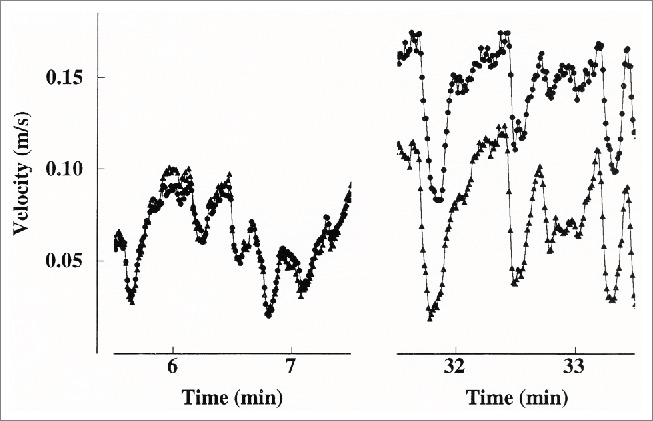
Figure 10.

Two shorter blood velocity recordings from bilateral arteries sampled beat by beat, also displayed in Figures 9, B and C, marked by solid bars. Left panel: before heating. Right panel: after heating. Circles: heated finger artery. Triangles: control finger artery. (From Bergersen, Eriksen and Walløe19) © The American Physiological Society. Reproduced by permission of The American Physiological Society. Permission to reuse must be obtained from the rightsholder.
