
Figure 11.
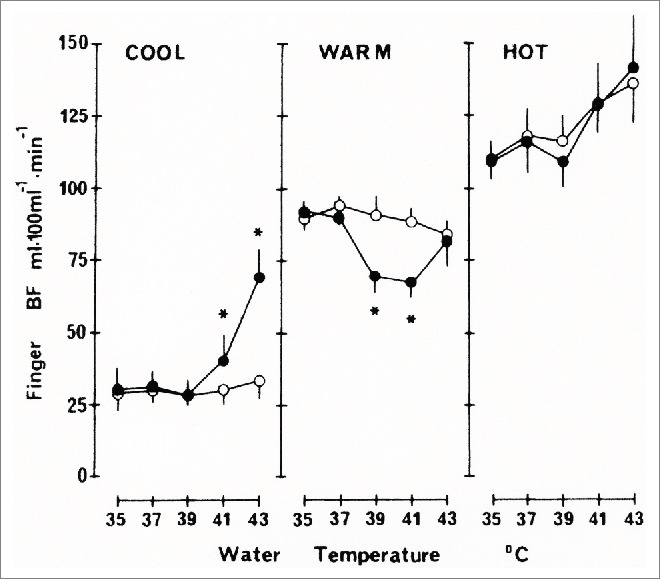
Changes in finger blood flow (BF) in locally heated hand (filled circles) and control hand (open circles) measured by finger occlusion plethysmography plotted against water temperature for the subject in 3 different thermal states. Values are means ± SE of 6 individual average values for each set of water temperatures. * Significantly different from corresponding value in control hand (p <0.05) (From Nagasaka26). © The American Physiological Society. Reproduced by permission of The American Physiological Society. Permission to reuse must be obtained from the rightsholder.