Figure 3.

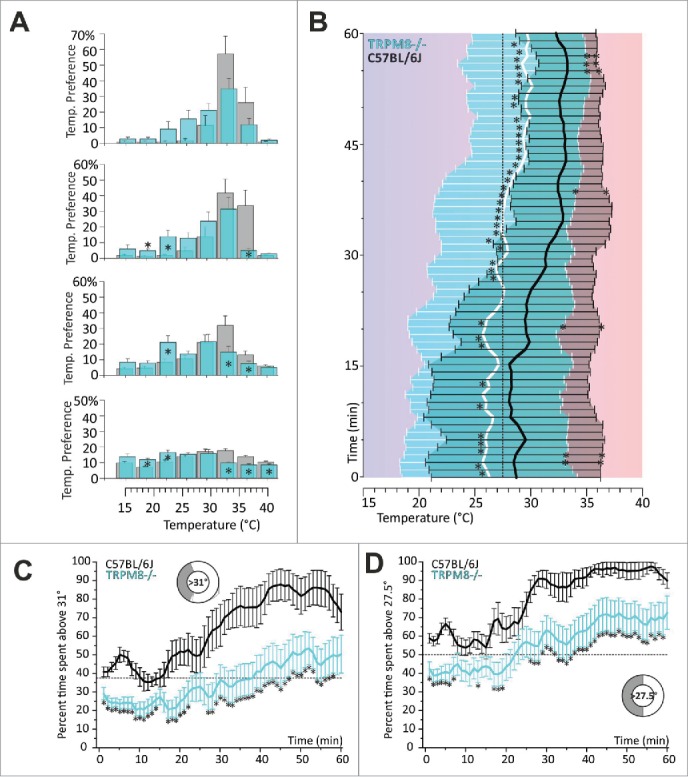
8-zone assay: TRPM8-deficient mice show warm avoidance and reduced avoidance of innocuous cool. (A) Eight-zone histograms of zone preference of TRPM8−/−: (blue bars: TRPM8−/−; gray bars: C57BL/6J): from bottom to top, zone preference is summarized for each consecutive quarter of an hour as percent of time spent in each of 8 zones. Respective values of preference temperature, including standard deviation are indicated in the Table 1. Note: in mins 1–45: TRPM8−/− mice show both warm avoidance and reduced cold avoidance. Error bars are SEM. (B) Preference temperature time course from bottom (start) to top (60 min): throughout 60 mins thermal selection behavior of TRPM8−/− is significantly different from control. Over time TRPM8−/− mice migrate to warmer, but prefer markedly cooler floor temperature than control mice. At later time points mice progressively migrate to warmer floor temperature which also results in a reduction in SD. Data were subjected to a 3pt averaging procedure. Error bars with areas under the curve in cyan (TRPM8) and black (control) indicate SD and SD are significantly different for the asterisks on error bars. (C, D) Timecourses of temperature selection: percent time spent (C) above 31°C and, (D) in the warmer semicircle (above 27.5°C), calculated in 1 min resolution (average of 60 values per min) and subjected to a 3pt averaging procedure. Note: warm avoidance of TRPM8−/− is evident in the initial 20 mins in both panels. Error bars are SEM. Sketches illustrate temperature and respective fraction of floor surface; dotted black line illustrates the random probability to cover the respective part of the assay. Error bars indicate SEM. In all panels: colors: cyan: TRPM8−/− (n = 21), gray/black C57BL/6J (n = 14); asterisks refer to p < 0.05, T-test.
