
Figure 5.
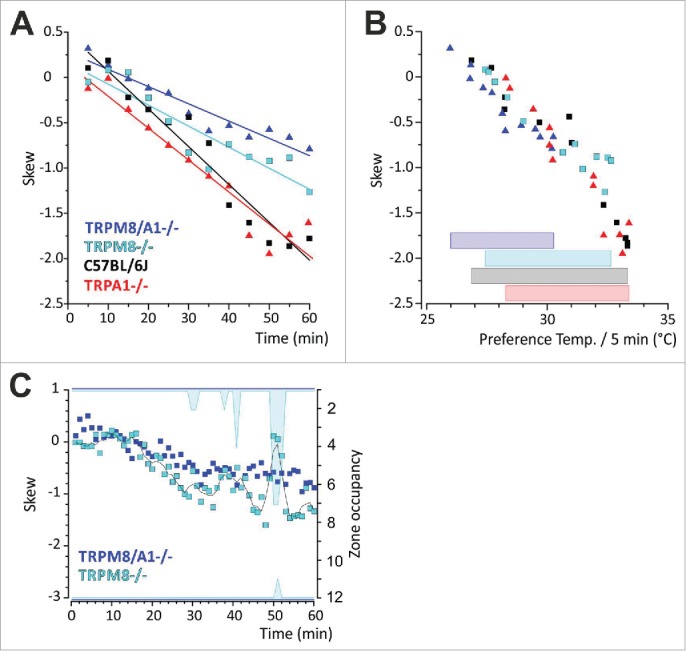
Skew as parameter to describe thermal preference behavior. (A) Linear regression analysis of skew and time. Skew is given as average per 5 mins. (A) In contrast to controls and TRPA1−/−, histogram distribution of thermal preference behavior of TRPM8 and TRPM8/A1-deficient mice yield less negative values for skew resulting from a less left-tailed distribution and corresponding to a preference of colder floor temperatures. (B) Scatterplot of skew and preference temperature in 5 min bins. Reduced range of preferred temperatures and colder preference temperatures in TRPM8/A1−/− correspond to less negatively skew data. Specifically, the bars at the bottom of the panel illustrate the range of preference temperature for each strain, C57BL/6J (black), TRPA1−/− (red), TRPM8−/− (cyan) and TRPM8/A1−/− (blue); (C) Influence of altered upper or lower bounds on skew. Skew is calculated in minute resolution for TRPM8−/− and TRPM8/A1−/−. Right y-axis illustrates zone occupancy in each minute. Cyan areas indicate zones that were left uncovered. In TRPM8−/− upper or lower bounds are reduced in mins 30–31, 38–41 and 50–52 which is the result for reduced values for skew. Black line is 3pt average. TRPM8/A1−/− show left tailed skews with progressive change over time due to thermal selection with bounds unchanged.