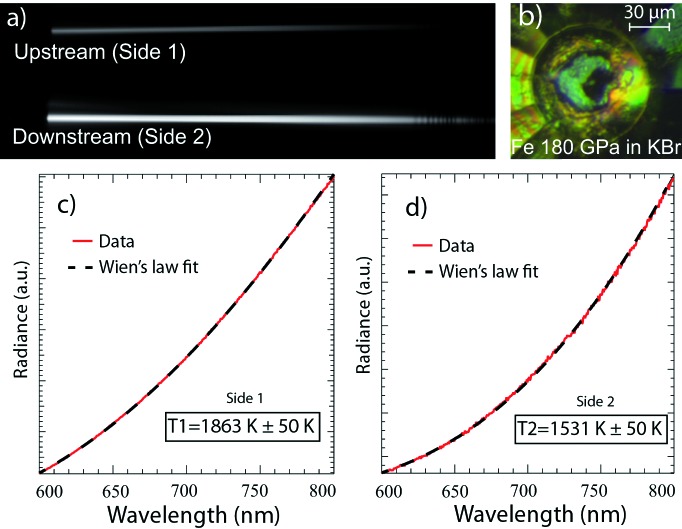
Figure 2.
Typical temperature measurements on a Fe foil at 180 GPa. The Fe sample is laser heated from side 1 with a CW Nd:YAG laser, and the temperature is recorded on both sides simultaneously through the double pinhole entrance of the spectrometer. (a) Two-dimensional image of the CCD strip, and (b) picture of the Fe sample embedded in KBr at 180 GPa. (c), (d) Data integrated, calibrated and fitted with Wien’s law from 600 to 900 nm to retrieve the temperature from both sides (only the portion from 600 to 800 nm is shown here).

