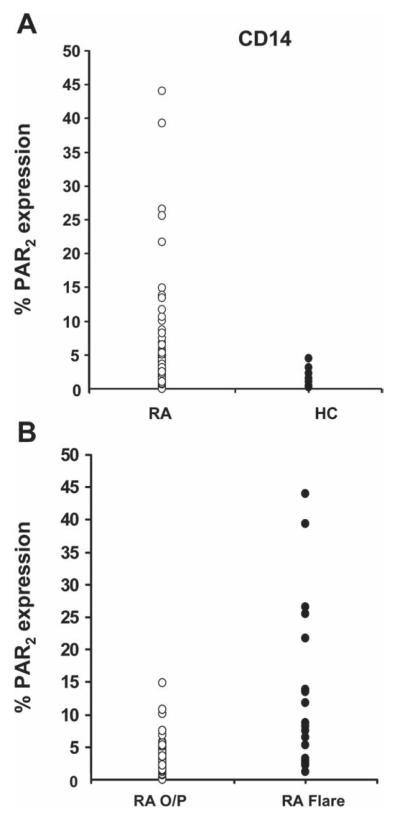
Figure 2.
(A) Dot plots comparing surface expression of proteinase-activated receptor 2 (PAR2) in CD14+ cells in patients with rheumatoid arthritis (RA, n=94) and healthy control subjects (HC, n=15). Mann–Whitney rank sum test showed a significant difference (p<0.0001) between the two groups. (B) Surface expression of PAR2 in CD14 cells in patients with RA attending outpatients (RA O/P, n=75) compared with those admitted to the ward during a flare (RA Flare, n=19). Rank sum test showed a highly significant difference (p<0.0001) between these two groups. Median values and IQR given in text.

