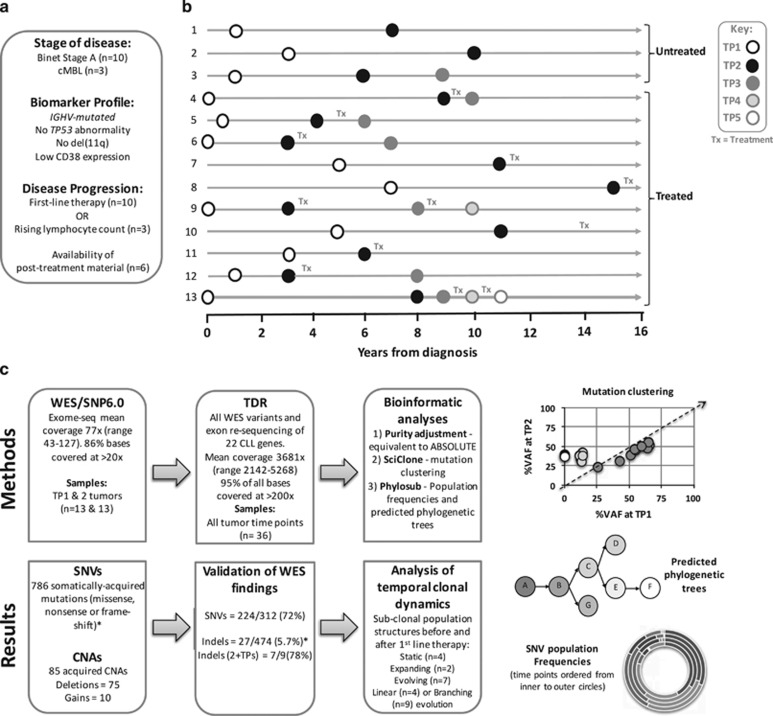
Figure 1.
Study overview. (a) Inclusion criteria for study and definition of disease progression. (b) Tumour TP sampling time line for the 13 patients. Tx, treatment. (c) Flow diagram describing genomic analyses and result summaries. Example data plots for SciClone mutation clustering, Phylosub phylogenetic trees and concentric pie charts (each layer, inner to outer, is a sampling TP) displaying imputed SNV population frequencies at each phylogenetic node. *For indel filtering we accepted a high-false positive WES rate to ensure we could capture all of the 'true' somatically acquired indel variants by TDR (Supplementary Methods). When considering indels present in two or more tumour TPs (2+TPs) our indel TDR validation rate (78%, 7/9%) was in line with the SNV rate (72%).

