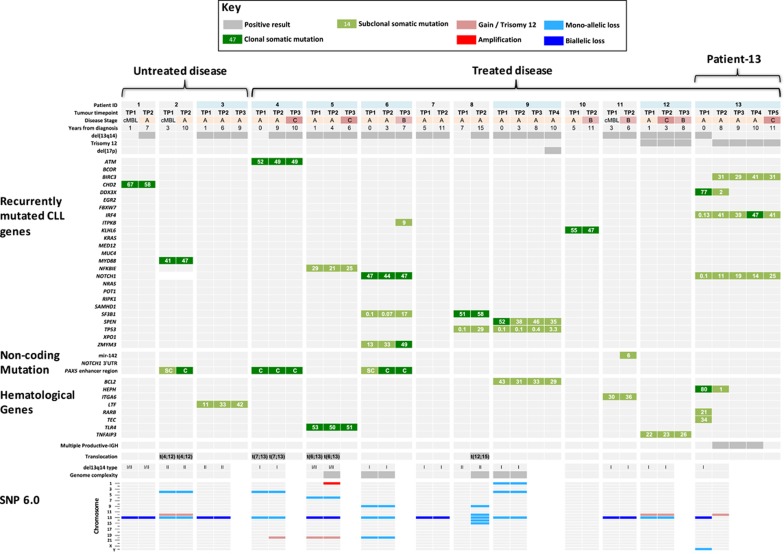
Figure 2.
Heat-map representation of tumour TPs analysed by WES and targeted deep re-sequencing. From top to bottom: key to heat-map cell shading. Patient characteristics, light blue cell shading indicates patients with follow-on tumour samples (that is, TP3, TP4 and TP5); dark-grey cells indicated a positive result. Sub-clonal (light-green cells) and clonal mutations (dark-green cells) in each patient, grouped into recurrently mutated CLL driver genes, non-coding mutation described in Puente et al.6 and genes mutated in haematological malignancies. Numbers in cells denote tumour purity-adjusted %VAFs from TDR. SC, sub-clonal; C, clonal from Sanger-seq traces. Presence of multiple productive-IGH relating to patient 13, chromosomal translocation or genome complexity is denoted by dark-grey cells. SNP6.0 data for TP1 and TP2 samples.

