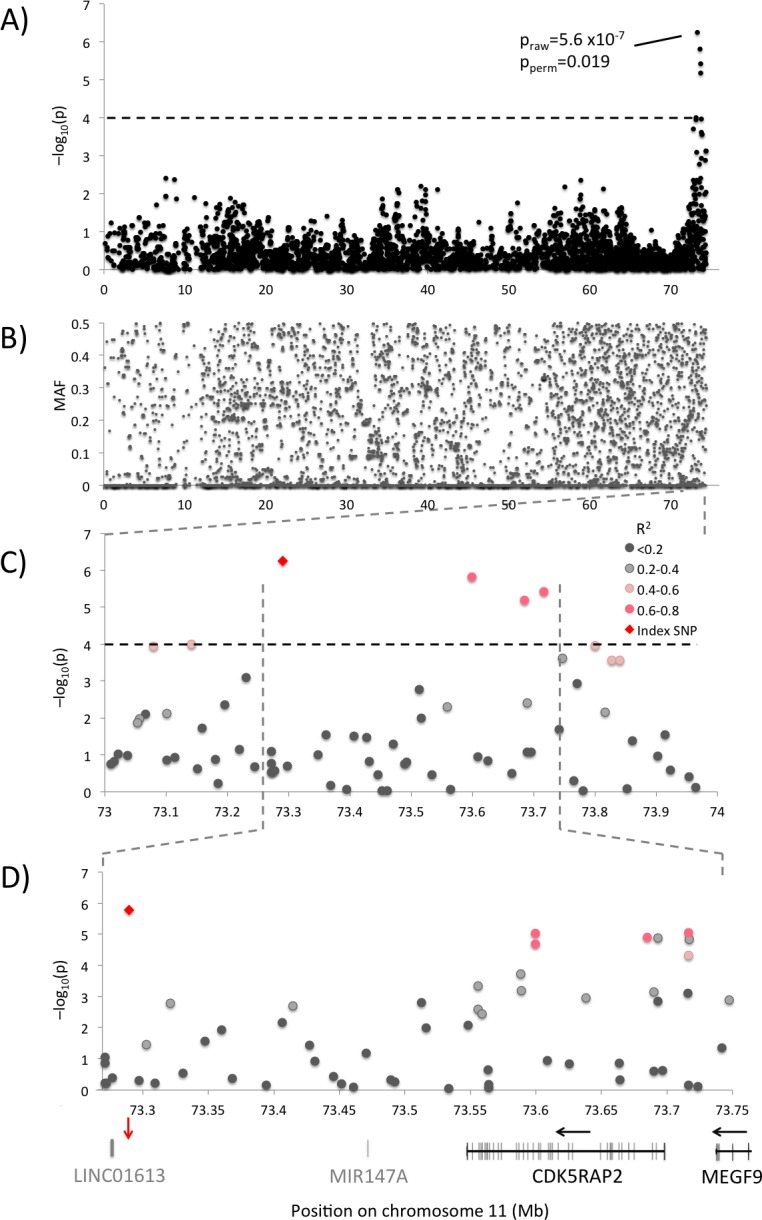
Fig 2. Association results for chromosome 11.

(A) Association plot and (B) Minor allele frequency plot for chromosome 11. (C) Candidate region with association results colour-coded according to pair-wise LD (r2) with the top SNP (index). (D) Candidate region showing association results for the merged and imputed GWAS and sequence candidate SNP dataset with colours according to pair-wise LD (r2) with the top SNP. The top haplotype spans a region containing CDK5RAP2, MEGF9 and potentially also MIR147A and LINC01613. Black arrows indicate direction of transcription and red arrow the top SNP position.
