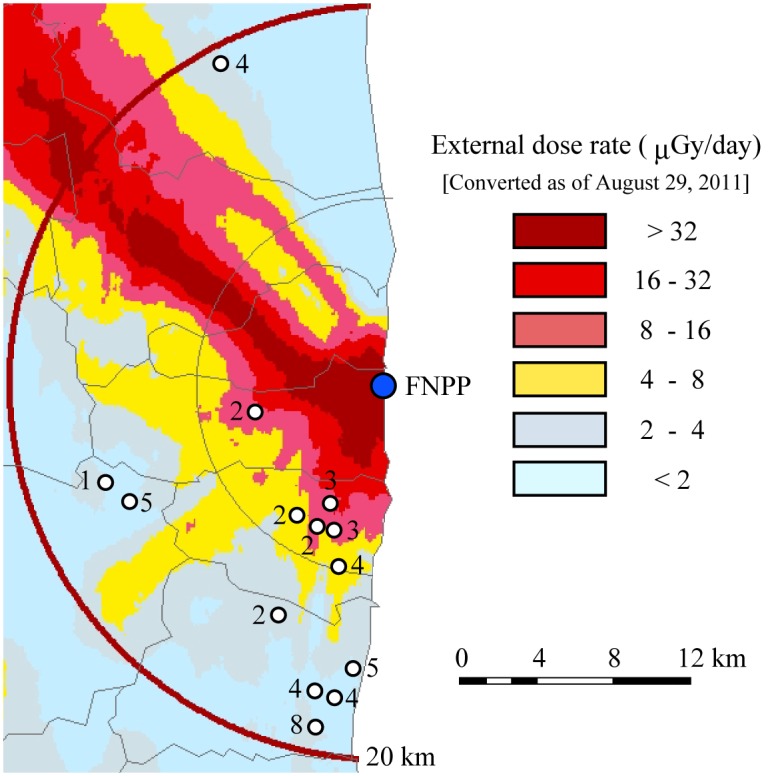
Fig 1. Map showing the sampling point.

A blue circle indicates the location of Fukushima Daiichi Nuclear Power Plant. White circles indicate the sampling point of cattle. The number indicates the number of cattle captured on each site. Modified from the 2-km mesh soil contamination measurement [21] using a System for Automated Geoscientific Analyses (SAGA) geographic information system (GIS) computer program [22].
