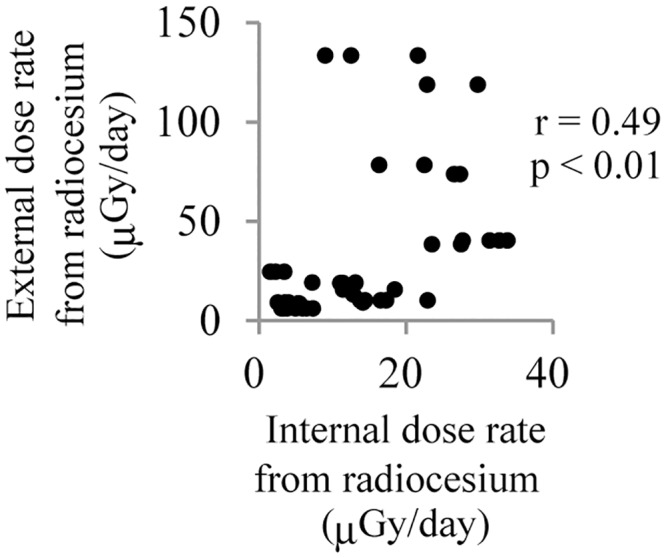
Fig 2. Correlation analysis between internal dose rate and external dose rate.

The dot plot shows the correlation of internal dose rate with external dose rate in cattle in the ex-evacuation zone. r and p is Pearson’s correlation coefficient and p value, respectively.
