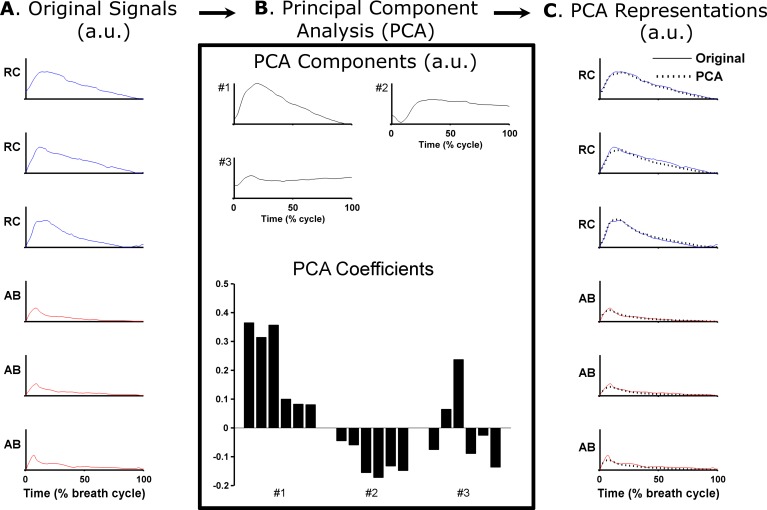
Fig 2. Example of extraction of typical breathing patterns using Principal Component Analysis (PCA).
In A, rib cage (RC) and abdominal (AB) volumes are shown for three consecutive breath cycles of a classical singer performing a singing task (task 1: Waltzing Matilda). These waveforms were used to calculate the PCA components and PCA coefficients shown in B. In this example, three components explained more than 98% of the total variability of the original signals. The PCA representations in C were obtained by weighting the PCA components by the corresponding PCA coefficients. The typical breathing pattern for this subject (not shown) was obtained by weighting the PCA components by the average PCA coefficients across all breath cycles. a.u.: Arbitrary units.

