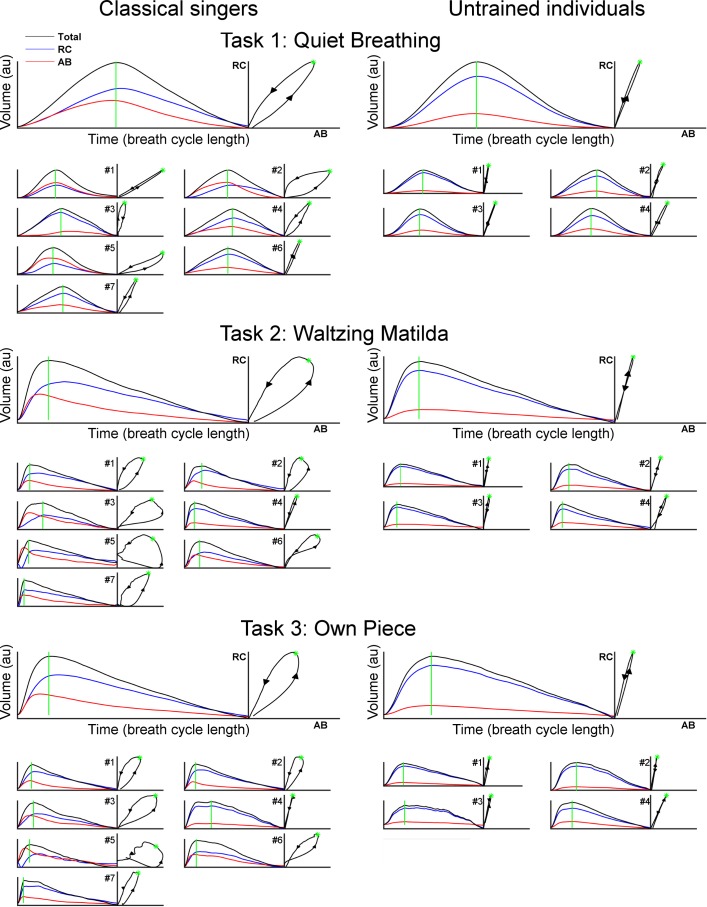
Fig 7. Typical breathing patterns of classical singers and untrained individuals extracted using principal component analysis.
The group’s typical patterns are represented in the large axes, whereas patterns of individual participants are represented in small axes. Volume waveforms are shown with the corresponding Konno-Mead plots of RC and AB movements. The arrowheads in the Konno-Mead plots illustrate the time course, i.e. ascending and descending arrows correspond to inspiratory and expiratory phases, respectively. The start of expiration phase is marked in green both in the time plots and Konno-Mead plots. Note: The raw data shown in Fig 3 were recorded from classical singer #1 and untrained individual #4.

