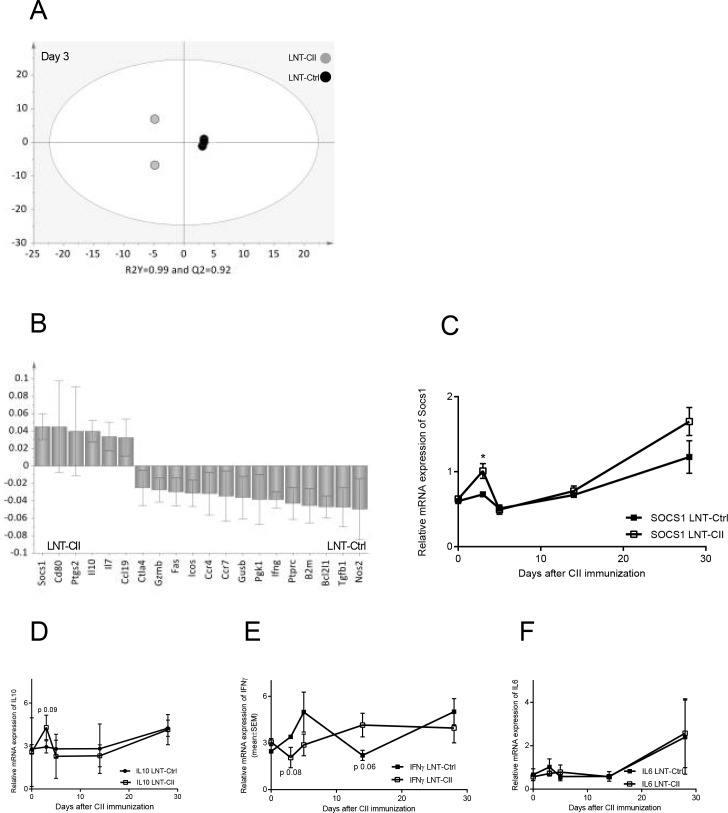
Fig 5. qPCR array and SOCS1 association with LNT-Ctrl vs LNT-CII at day 3 after CII immunization.
(A) OPLS-DA scatter dot plot showing the separation of gene expression in tolerized or non-tolerized mice and (B) OPLS-DA column loading plot that depicts the association between LNT-CII and LNT-Ctrl mice with the expression of different genes. X-variables represented with a positive bar are positively associated with LNT-CII mice, whereas variables in the opposite direction are inversely related to this group of mice. The larger the bar and smaller the error bar, the stronger and more certain is the contribution to the model. The final OPLS-DA loading plots are based on parameters with VIP values ≥1.3. R2Y indicates how well the variation of Y is explained, whereas Q2 indicates how well Y can be predicted. Univariate analysis (Student’s t-test) of (C) SOCS1 (D) of IL-10 (E) IFN-γ (F) IL-6, n = 2–4 animals/group, mean ± SEM. Actb and Gadph were selected as housekeeping genes and relative quantification was calculated from the sample of a naïve DBA/1 mouse.

