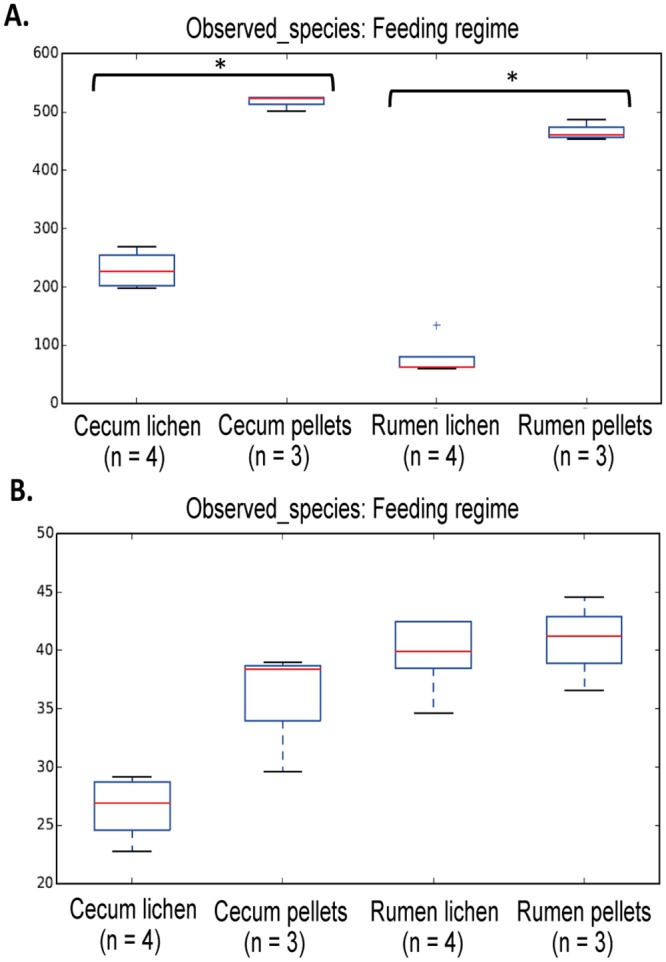
Fig 3. Box-plots within-sample community diversity comparisons from rumen and cecum samples in Norwegian reindeer.

(A) Mean alpha diversity values for total unique OTUs (observed_species) calculated for the bacterial fraction of the microbiome. (B) Mean alpha diversity values for total unique OTUs (observed_species) calculated for the archaeal fraction of the microbiome. Box-plots were calculated using average values obtained from randomly subsampled datasets for each sample with a sample depth of 2000 sequences and 10 iterations at each subsampling step. Pairwise comparisons were performed only between samples from the same sample site (rumen or cecum) and statistical significance (asterisk symbol; p<0.05) was calculated with non-parametric t-test with Monte Carlo permutations (n = 999).
