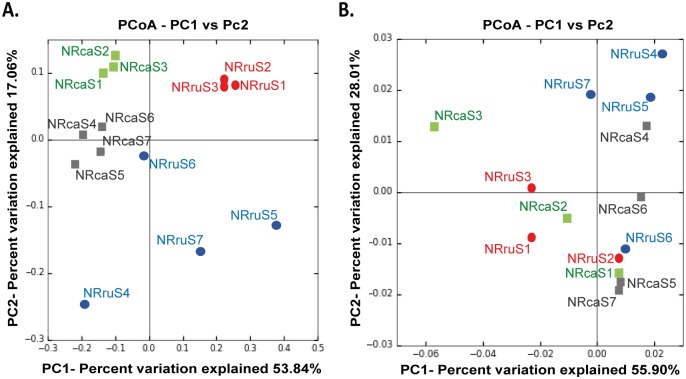
Fig 4. Principal coordinate analysis of the microbial community structure from rumen and cecum in Norwegian reindeer.
(A) PCoA plot illustrating the bacterial community structures. (B) PCoA plot illustrating the archaeal community composition. PCoA plots were generate based on weighted UniFrac distance matrices. Colour style and labelling refers to the type of diet provided and sample origin: rumen samples from reindeer fed pellets (rumen-pellets) (red dots); rumen-lichens (blue dots); cecum-pellets (green squares); cecum-lichens (dark-grey squares). Statistical comparisons were performed only between samples from the same sampling site (rumen or cecum).

