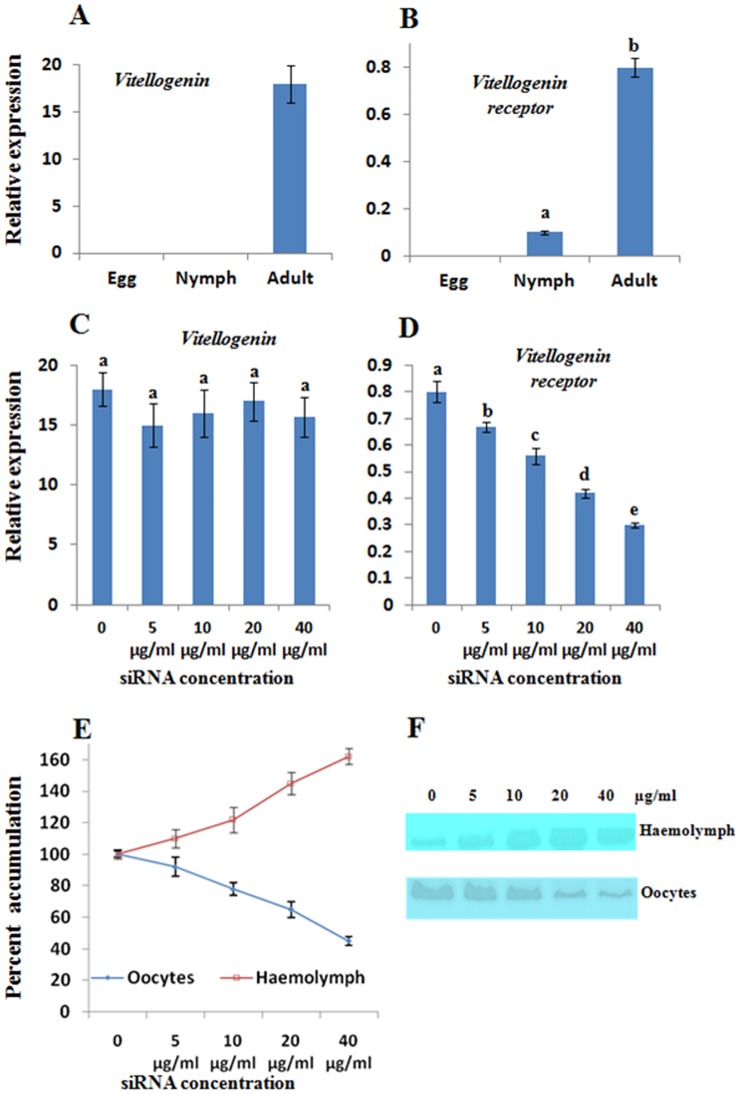
Fig 5. Expression analysis of BtA1Vg and BtA1VgR.
The transcript expression was normalized with the actin expression. (A) Transcript expression of BtA1Vg in egg, nymph and adult. (B) Transcript expression of BtA1VgR in egg, nymph and adult. (C) Transcript expression of BtA1Vg in adult insects after 3 days of feeding of various concentration of siRNA. (D) Transcript expression of BtA1VgR in adult insects after 3 days of feeding of various concentration of siRNA. (E) Comparative accumulation of BtA1Vg protein in oocyte and haemolymph of adult insects after 3 days of feeding of various concentration of siRNA. The normal quantity was considered as 100% and relative accumulation was calculated in percent change. All the experiments were performed in three biological replicates and statistical analysis was performed. The different letters above each bar indicates significantly different data according to DMRT, preceded by a one-way ANOVA having p-value<0.05.

