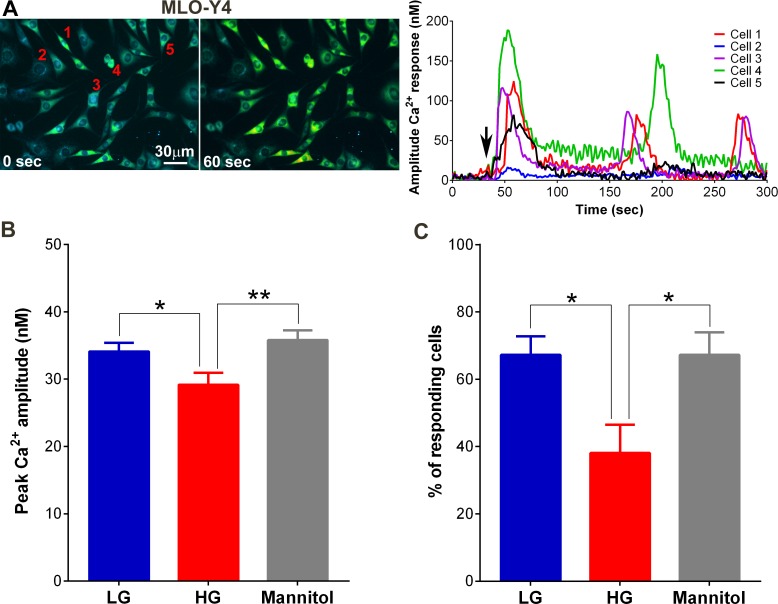
Fig 6. High glucose attenuates mechanically-induced Ca2+ responses of osteocytes in culture.
(A) Example of time-lapse pseudocolor display of intracellular Ca2+ and graphical representations of the amplitudes of OFSS-induced Ca2+ responses recorded from individual cells (1 to 5) in MLO-Y4 cultures under control low glucose (LG) condition. Black arrows in graphs indicate the start of OFSS. (B) Comparison of peak Ca2+ amplitudes under low glucose (LG), high glucose (HG) and mannitol conditions (*P<0.05 LG vs. HG, **P<0.01 mannitol vs. HG; n = 12 independent experiments). (C) Percentage of cells responding to OFSS stimulation in high glucose (HG) condition compared to control low glucose and mannitol conditions. (Data are presented as the means ± SEM. *P<0.05, high glucose vs. low glucose and mannitol, n = 12 independent experiments; average number of cells analyzed per experiment = 57 ± 4 cells).

