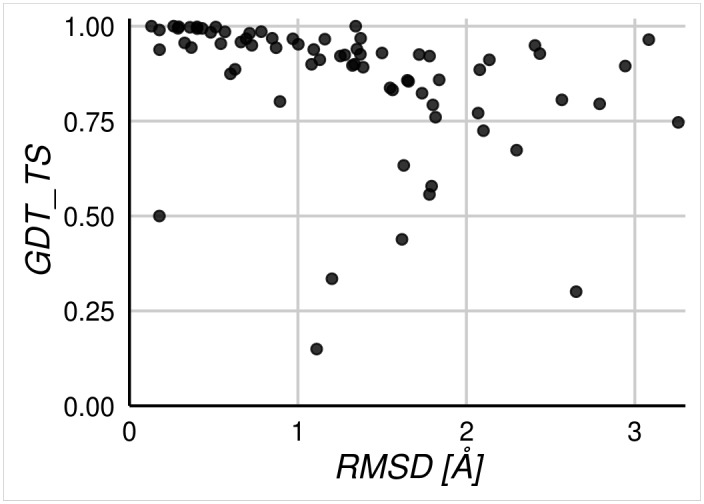
Fig 1. Comparison of GDT_TS against RMSD, calculated for pairs of conformers with maximum conformational diversity for each protein in our dataset.

Pairs were taken from the CoDNaS database of different structures (from available PDB files) for each represented protein. RMSD scores are expressed in Å while GDT_TS values are normalized to the range [0, 1].
