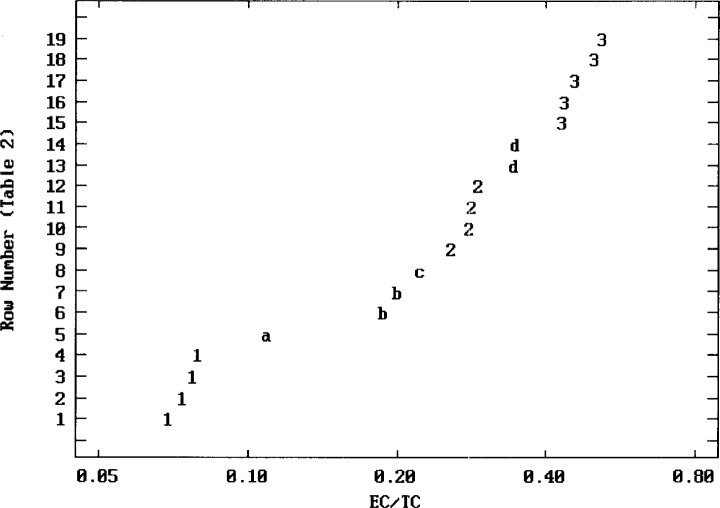
Fig. 2.
Empirical cluster display of the EC/TC data. Ordered results (≈ 7 % to 50 % EC) from the 19 method-team combinations of Table 2 are displayed on a log axis (for variance stabilization), with clusters identified by the quantitative gap cluster algorithm [56]. Descriptive statistics [medians (quartiles)] for the three primary clusters (n > 2) are: 1) 0.075 (0.071, 0.078) 2) 0.28 (0.27, 0.29) 3) 0.46 (0.44, 0.50).
The remaining four secondary clusters are comprised of two singletons (a,c) and two pairs (b,d). Smaller values of EC/TC may be interpreted as EC loss (artifact) and/or more refractory EC (“soot”). Larger values may be interpreted as OC captured in the EC fraction (artifact) and/or more labile EC (“char”). Result-specific physical-chemical bases for such trends are discussed in the text.

