Figure 4.

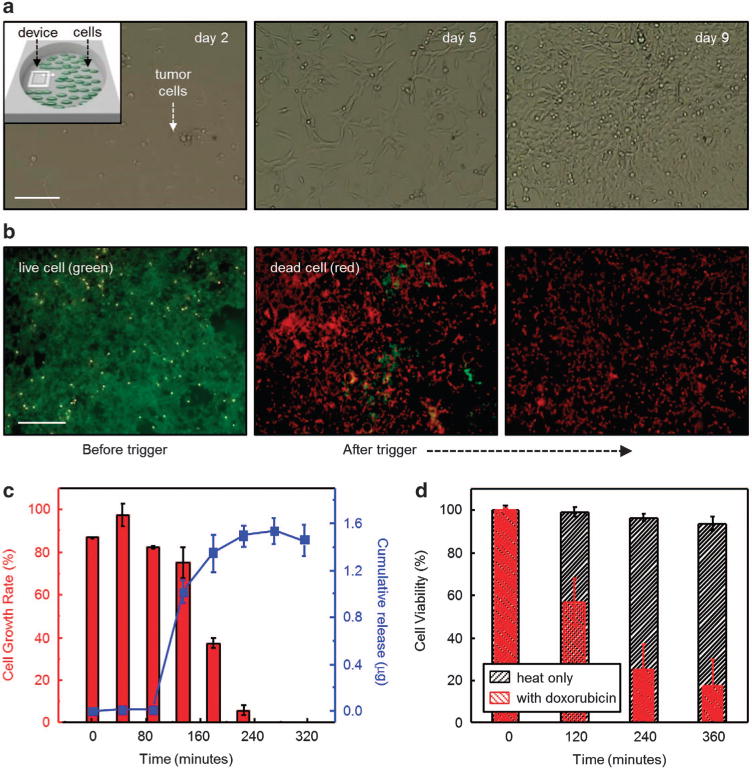
In vitro evaluations of a device in a proliferation/viability assay using human tumor cells (HeLa). (a) Optical microscope images (scale bar: 100 μm) of tumor cells at different incubation times (day 2, 5, 9 from left to right). The inset in the upper left of the left frame provides a schematic illustration of the location of the device relative to the cells. (b) Fluorescent optical images (scale bar: 500 μm) of the tumor cells before and after programmed release of drug. Green and red colors represent live and dead cells, respectively. (c) Proliferation assay and a corresponding release profile of doxorubicin. (n = 3, averaged data points and error bars are represented). (d) Viability assay using devices with (red) and without (black) doxorubicin. (n = 3, averaged data points and error bars are represented).
