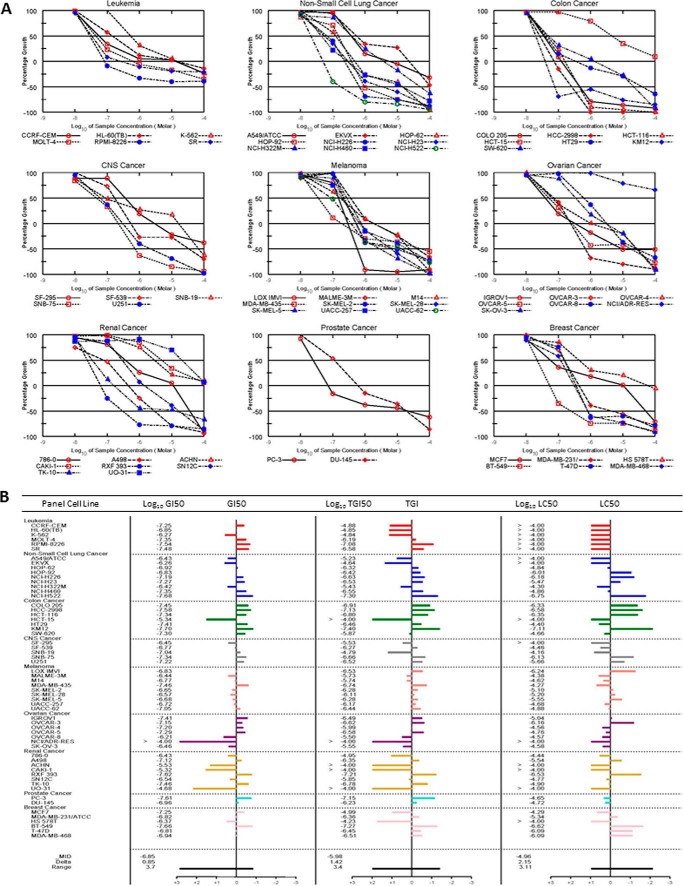
FIGURE 6.
Antiproliferative effect of proteasome inhibitor TIR-199 in the NCI-60 human tumor cell line panel. Dose-response curves for TIR-199 (NSC:761526). A, a panel of 60 human tumor cell lines representing nine different cancerous tissues of origin (leukemia, non-small cell lung cancer, colon cancer, CNS cancer, melanoma, ovarian cancer, renal cancer, prostate cancer, and breast cancer) was tested at the NCI-DTP in the presence of TIR-199 at five concentrations. TIR-199 was tested over a 10,000-fold concentration range in a 2-day assay and exhibited dose-dependent growth inhibition to various degrees, in all tested tumor cell lines. B, dose-response data of A were used to calculate three end points for each cell line: GI50 (the log10 of the concentration that caused 50% growth inhibition), TGI (the log10 of the concentration that caused total growth inhibition), and LC50 (the log10 of the concentration that caused 50% lethality). For each end point, the mean across all the cell lines was calculated. The GI50 data are graphed as the difference of the GI50 for a particular cell line from the mean GI50. Cell lines that are more sensitive are represented as bars deflecting to the right of the mean, and less sensitive cell lines project to the left of the mean. TGI and LC50 mean graphs are generated in a similar fashion. One representative data set of three independent experiments is shown (n = 3), except for the leukemia cell panel (n = 2). For additional information about the NCI-60 cell line panel, see Ref. 34 and “Experimental Procedures.”

