
FIGURE 1.
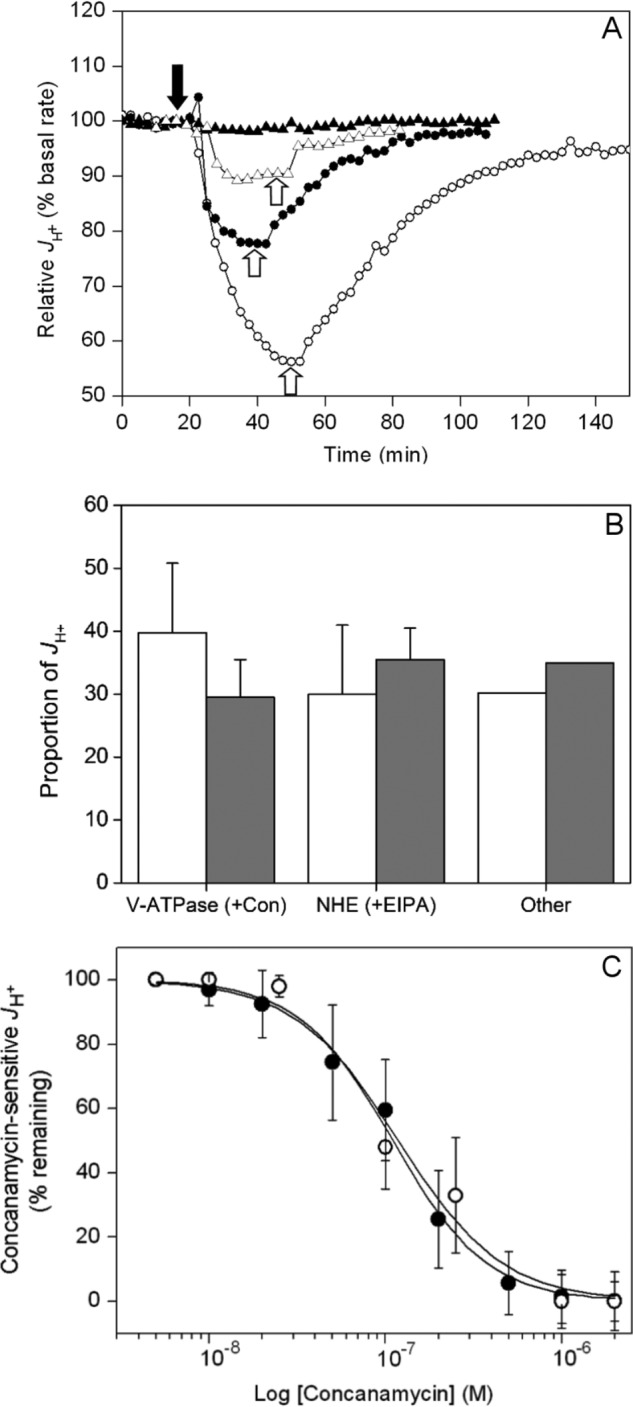
V-ATPase activity at the plasma membrane of prostate carcinoma cells. A, example microphysiometry traces for PC-3 cells. Concanamycin A was added as indicated by the solid arrow and washed out at the points indicated by the open arrows. Solid triangles indicate vehicle only (DMSO); open triangles indicate 50 nm; solid circles indicate 100 nm; open circles indicate 1 μm. B, relative contributions of V-ATPase and NHE1 activities to H+ extrusion by PC-3 (white, n = 10 (three readings per measurement)) and LNCaP (gray, n = 6 (3 cell samples per measurement)) prostatic carcinoma cells were determined as in A and expressed as the activity lost after addition of 2 μm concanamycin A (V-ATPase contribution), 50 μm ethyl isopropylamiloride (NHE1 activity), with the residual activity being the sum of other unassigned activities. Error bars represent the standard deviation for measurements with each inhibitor (PC-3, n = 10; LNCaP, n = 6). Differences between relative V-ATPase contributions to JH+ in the two cells types are not statistically significant (p = 0.055, unpaired t test). C, inhibition curves for the concanamycin-sensitive component of JH+ of PC-3 (solid circles) and LNCaP cells (open circles). Values are expressed as the percentage of the concanamycin-sensitive activity in B remaining after inhibitor addition. Error bars represent standard deviation of each measurement (n = 4). EC50 for both cells lines is ∼100 nm.