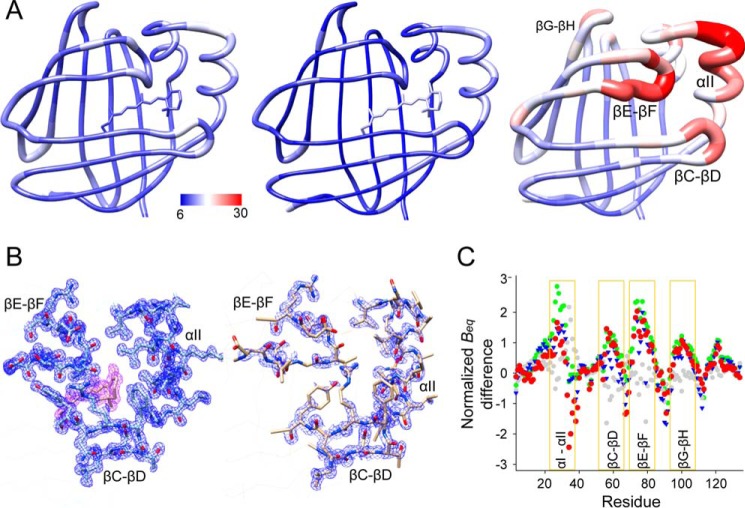
FIGURE 6.
Differences in the equivalent isotropic B-factors between apo- and holo-hCRBP1. A, graphic representation of the residue average Beq in all-trans-retinol holoprotein (left, PDB code 5HBS), its retinylamine-bound state (middle, PDB code 5HA1), and apo-form (right, PDB code 5H9A) colored from low to high (blue to red). Regions of the apo-hCRBP1 with the highest conformational flexibility are identified by labels. B, 2Fo − Fc electron density maps (blue mesh) of α-helix II and hairpin turns βC-βD and βE-βF for a 1.21 Å structure of all-trans-retinol holo-hCRBP1 (left) (PDB code 5H8T) and apoprotein (right). The purple mesh represents electron density for the ligand. All maps were contoured at 1.2σ. C, comparison of the normalized Beq. The plot represents relative differences and indicates regions with increased conformational dynamics. The color scheme corresponds to the following paired structures: green, apo- (PDB code 5H9A) versus vitamin A holo- (0.89 Å resolution structure, PDB code 5HBS); blue, apo- (PDB code 5H9A) versus vitamin A holo- (1.21 Å, PDB code 5H8T); red, apo- (PDB code 5H9A) versus retinylamine holo- (PDB code 5HA1); and gray, vitamin A holo- (PDB code 5H8T) versus retinylamine holo-hCRBP1 (PDB code 5HA1).

