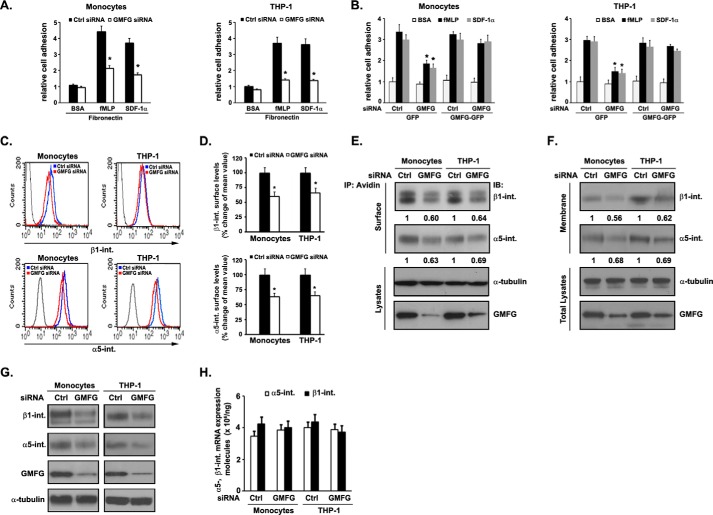
FIGURE 2.
GMFG knockdown decreases chemoattractant-stimulated cell adhesion to FN and cell surface expression of α5β1-integrin in human monocytes. Human monocytes or THP-1 cells were transfected with control negative siRNA (Ctrl siRNA) or GMFG siRNA for 48 h. A, siRNA-transfected human monocytes or THP-1 cells were subjected to adhesion assays on 10 μg/ml FN-coated wells (in triplicate samples) in the absence (Ctrl) or presence of fMLP (100 nm) or SDF-1α (100 ng/ml). Values were calculated as -fold increase over levels in unstimulated cells treated with control negative siRNA. Each assay was performed in triplicate. Data represent the mean ± S.D. (error bars). *, p < 0.05 compared with control siRNA-transfected cells. B, human monocytes or THP-1 cells were cotransfected with control negative siRNA or GMFG siRNA and GFP vector or GFP-GMFG vector and then subjected to an in vitro adhesion assay on 10 μg/ml FN-coated wells (in triplicate samples) in the absence or presence of 100 nm fMLP or 100 ng/ml SDF-1α. Values were calculated as -fold increase over levels in unstimulated cells treated with control negative siRNA. Data represent three independent experiments and are expressed as the mean ± S.D. *, p < 0.05 compared with control negative siRNA-transfected cells. C, representative flow cytometry results for cell surface expression of β1-integrin (top panels) or α5-integrin (bottom panels) in siRNA-transfected human monocytes or THP-1 cells. Cells were labeled with antibodies to β1-integrin (both the active and inactive forms, MEM101A) or α5-integrin (NKI-SAM1) for 1 h at 4 °C, followed by incubation with Alexa Fluor 488-conjugated goat anti-mouse secondary antibody, and then subjected to flow cytometry analysis. D, quantification of integrin cell surface expression flow cytometry results as in C. Data represent the mean fluorescence intensity ± S.D. of three independent experiments. *, p < 0.05 compared with control siRNA-transfected cells. E, cell surface-biotinylated β1-integrin or α5-integrin in siRNA-transfected human monocytes or THP-1 cells. Surface-biotinylated proteins were precipitated using avidin beads, followed by Western blotting analysis with β1-integrin (MAB2000) or α5-integrin (4705P, Cell Signaling) antibodies (top panels). 20% input total cell lysates were analyzed by Western blotting analysis of α-tubulin or GMFG (bottom panels). α-Tubulin was used as a loading control. The densitometric analysis of the relative quantification of β1- and α5-integrin signal intensities (normalized to control siRNA-transfected integrin signal set at 1) is shown below each blot. F, plasma membrane expression of β1- or α5-integrin in siRNA-transfected monocytes or THP-1 cells. The plasma membrane fraction of cells was isolated and then subjected to Western blotting analysis with β1-integrin (MAB2000) or α5-integrin (4705P, Cell Signaling) antibodies (top panels). 20% input total cell lysates were analyzed by Western blotting analysis of α-tubulin or GMFG (bottom panels). α-Tubulin was used as a loading control. The densitometric analysis of the relative quantification of β1- and α5-integrin signal intensities (normalized to control siRNA-transfected integrin signal set at 1) is shown below each blot. G, Western blotting analysis of β1-integrin, α5-integrin, and GMFG expression in whole-cell lysates from siRNA-transfected monocytes or THP-1 cells. α-Tubulin was used as a loading control. H, quantitative PCR analysis of the expression of α5-integrin and β1-integrin transcripts in control siRNA- or GMFG siRNA-transfected human monocytes or THP-1 cells. Data represent the mean ± S.D. of three independent experiments. IP, immunoprecipitation.

