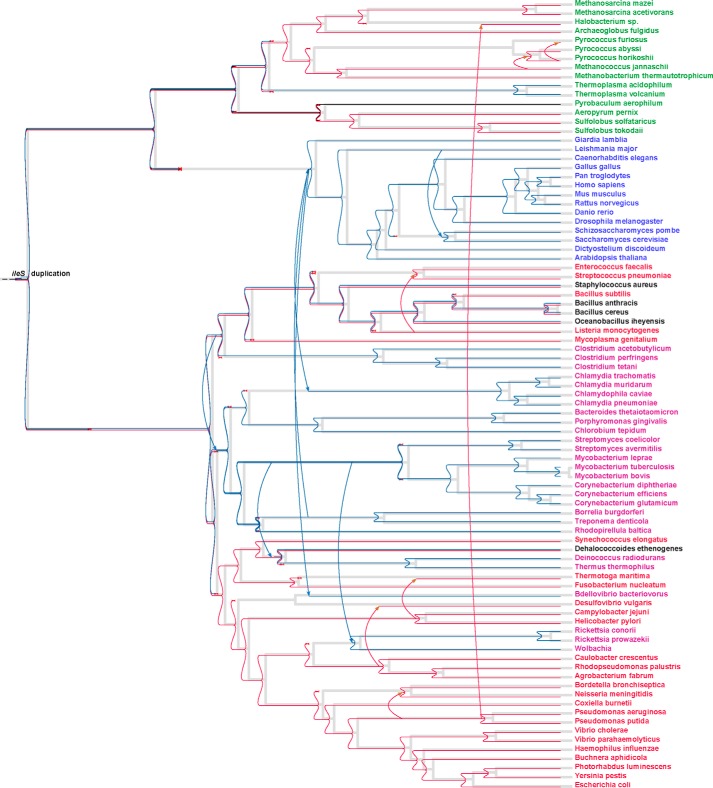
FIGURE 6.
Most parsimonious reconciliation of the IleRS gene tree and the corresponding species tree. Species with bacterial IleRS (bIleRS1) are colored red; species with eukaryote-like IleRS are shown in purple; species with both bIleRS1 and bIleRS2 are shown in black; archaeal species are green, and eukaryotes are blue. The gray lines represent the species tree, and the colored lines represent evolutionary events associated with the gene tree as follows: horizontal lines denote speciation; arrows denote the most probable horizontal gene transfers that explain the occurrence of the IleRS type in a certain organism; red cross marks a loss of a gene; and a blue square (denoted also with ileS duplication) marks the duplication event. The red and blue colors mark the duplication event and further separation and speciation of bIleRS1 and bIleRS2, respectively.

