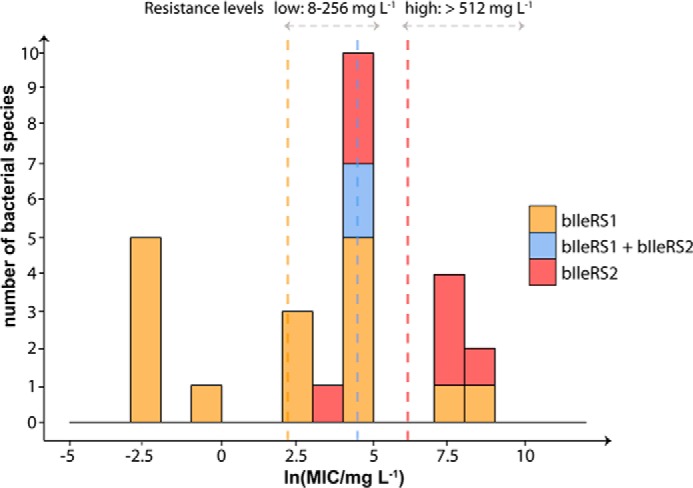
FIGURE 7.

Distribution of mupirocin MIC values for bacterial species. The MIC values were compiled from the literature (37, 41, 47, 56), and the corresponding IleRS type was assigned according to sequence similarity and phylogenetic analysis. The range of ln(MIC) values was divided into 12 bins (bin width equals 1 unit), and the number of species in each bin was plotted on the y axis. The overlapping columns are shown as stacked. The vertical lines represent the mean value for each group (line colors correspond to group colors). The levels of mupirocin resistance represent the literature values for acquired resistance in Staphylococcus species (59).
