FIGURE 5.
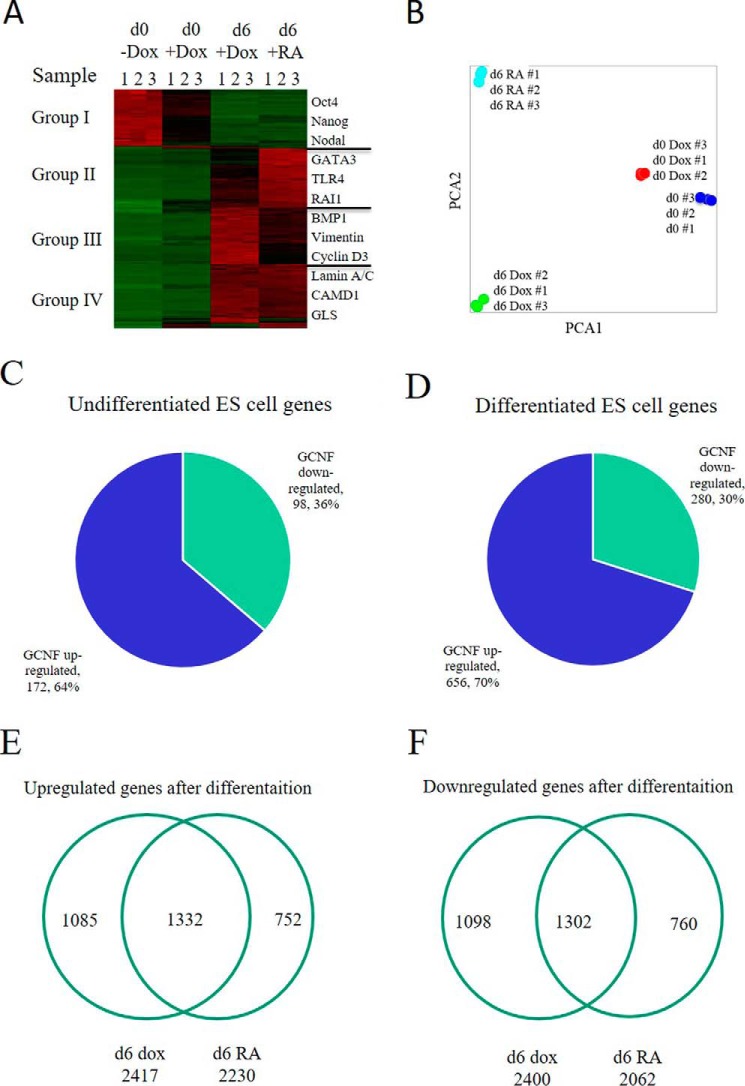
GCNF regulates gene expression in both undifferentiated and differentiated hES cells by mRNA array analysis. A, RNA microarray analysis of undifferentiated (d0) G-hES cells, d0 G-hES cells with Dox treatment, differentiated (d6) G-hES cells with Dox treatment, and d6 G-hES cells with RA treatment. The level of expression of mRNA was divided into four groups: Group I: genes that were expressed at high levels in d0 G-hES cells and whose level was very low after RA or Dox-induced differentiation. Group II: genes that were expressed in d6 G-hES cells at higher levels in RA-treated cells than in Dox-treated cells. Group III: genes that were expressed in d6 G-hES cells at higher levels in the Dox-treated cells than in RA-treated cells. Group IV: genes that were up-regulated in Dox-treated or in RA-treated d6 G-hES cells. Some genes whose expression markedly changed were listed beside the groups. B, PCA map from RNA microarray analysis of the different groups. C, overexpression of GCNF affected gene expression in undifferentiated hES cells. D, overexpression of GCNF affected gene expression during hES cell differentiation. E, genes up-regulated by Dox or RA treatment during G-hES cell at day 6 of G-hES cell differentiation. F, genes down-regulated by Dox or RA treatment at day 6 of G-hES cell differentiation.

