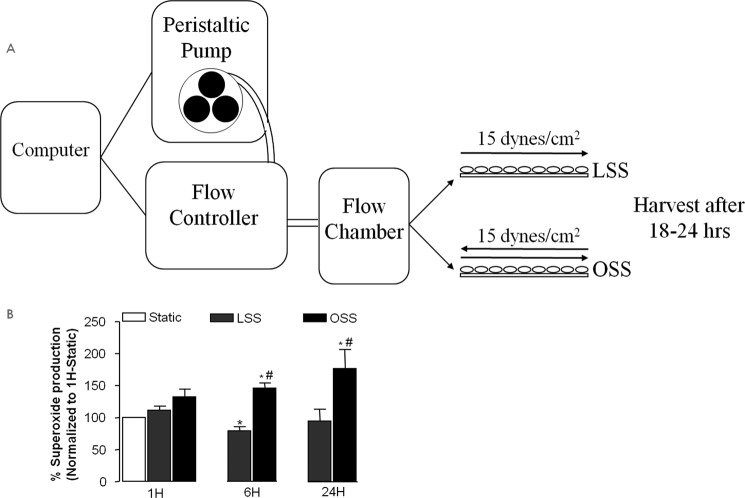
FIGURE 1.
A, schematic of the shear stress protocol. B, LSS and OSS regulation of superoxide production. Superoxide production was measured using electron spin resonance at different time points after exposure of bovine aortic endothelial cells to LSS or OSS (15 dynes/cm2). Data shown are mean ± S.E. from four to seven individual experiments. *, p < 0.05 compared with the static condition; #, p < 0.05 compared with corresponding LSS.

