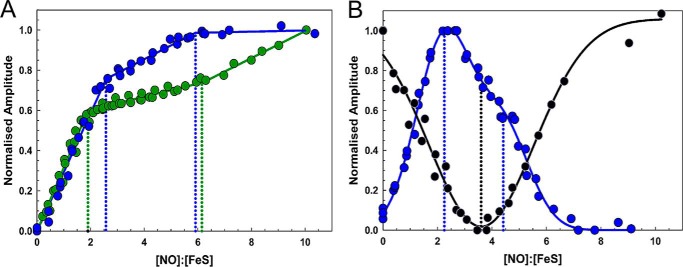
FIGURE 4.
Plots of spectroscopic changes as a function of NO concentration. A, normalized A360 nm − A420 nm (green circles) and CD430 nm (blue circles), and B, normalized CD330 nm (blue circles), and FI350 nm (black circles) plotted versus the [NO]:[FeS] ratio. Data are from two independent titrations (data for one of these are shown in Fig. 1).

