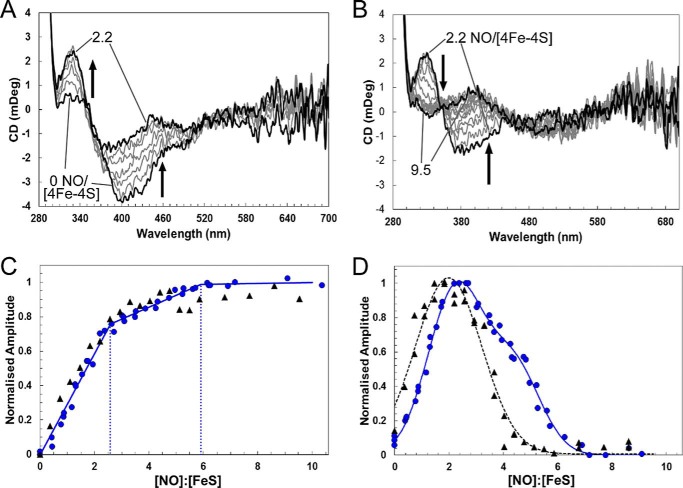
FIGURE 5.
The effect of DNA binding on [4Fe-4S] ScNsrR reaction with NO. CD spectra of [4Fe-4S] NsrR (16 μm [4Fe-4S] NsrR dimer, 32 μm [4Fe-4S]) following sequential additions of NO. A and B show CD spectra obtained during a titration equivalent to that in Fig. 2, C and D, in the presence of 32 μm dsDNA. Black lines show spectra recorded at [NO]:[FeS] ratios of 0 and 2.2 in A, and 2.2 and 9.5 in B. Arrows indicate the direction of intensity changes. ScNsrR was in 10 mm Tris, 54 mm KCl, 0.3% (v/v) glycerol, 1.5 mm GSH, pH 7.5. C and D, black triangles show normalized CD intensity at 430 and 330 nm, respectively, plotted versus the [NO]:[FeS] ratio for reaction in the presence of DNA. Equivalent data for reaction in the absence of DNA is replotted (blue circles) from Fig. 3 for comparison. Data are from two independent titrations (data for one are shown in A and B).

