FIGURE 6.
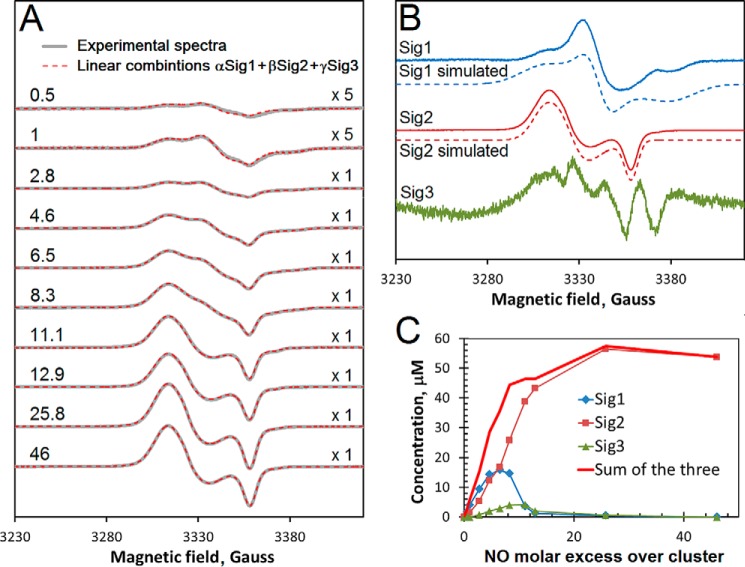
EPR analysis of DNIC formation during reaction of [4Fe-4S] NsrR with NO. A, EPR spectra following the addition of NO to 100 μm [4Fe-4S] NsrR (gray lines). The spectrum of NsrR prior to NO treatment was subtracted from each. The [NO]:[FeS] ratios are indicated. The first two spectra are magnified by a factor of 5 indicated by the “x” symbol (on the right). The experimental data are overlaid with linear combinations of the three EPR signals shown in B. The coefficients α, β, and γ used in these linear combinations are given in Table 1. B, the three EPR signals (solid lines) assumed to be basic components of all spectra shown in A, were obtained as described under ”Experimental Procedures.“ Signals 1 and 2 were simulated (dashed lines) with the following parameters: Sig1, gx = 2.0440, gy = 2.0246, and gz = 2.0000 (ΔHx = 25 G, ΔHy = 12 G, ΔHz = 25 G); Sig2, gx = 2.0426, gy = 2.0332, and gz = 2.0140 (ΔHx = 14 G, ΔHy = 14 G, ΔHz = 7 G). C, concentrations of the species responsible for EPR signals Sig1, Sig2, and Sig3 as functions of the excess of NO over cluster. Spectra were recorded at 77 K. Microwave power and frequency were 3.18 milliwatts and 9.47 GHz, respectively, and field modulation amplitude was 0.3 millitesla. The sample buffer was 50 mm Tris, 2 m NaCl, 5% (v/v) glycerol, pH 8.0.

