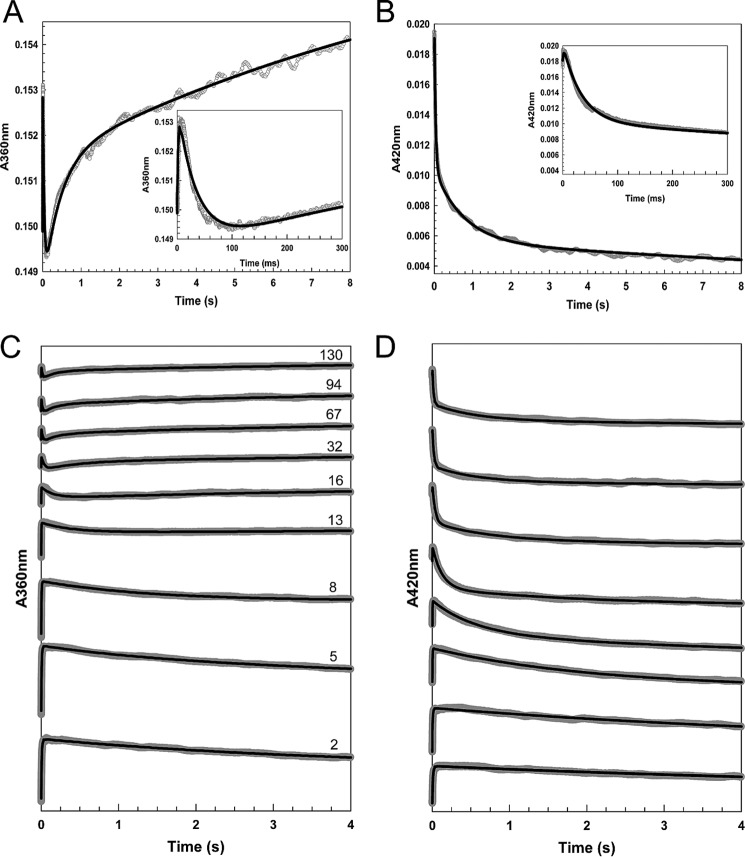
FIGURE 7.
Stopped-flow measurements of the reaction of [4Fe-4S] NsrR with NO. A–D, absorbance at 360 (A and B) and 420 nm (C and D) following the addition of NO to NsrR (∼7.6 μm). A and C show data at 360 and 420 nm, respectively, for the addition of ∼32 NO molecules per cluster. B and D show data at 360 and 420 nm, respectively, for a range of other NO:cluster ratios, as indicated. Insets in A and C show early events in the reaction time course. Fits to each of the observed phases (see ”Experimental Procedures“) are drawn in black lines.

