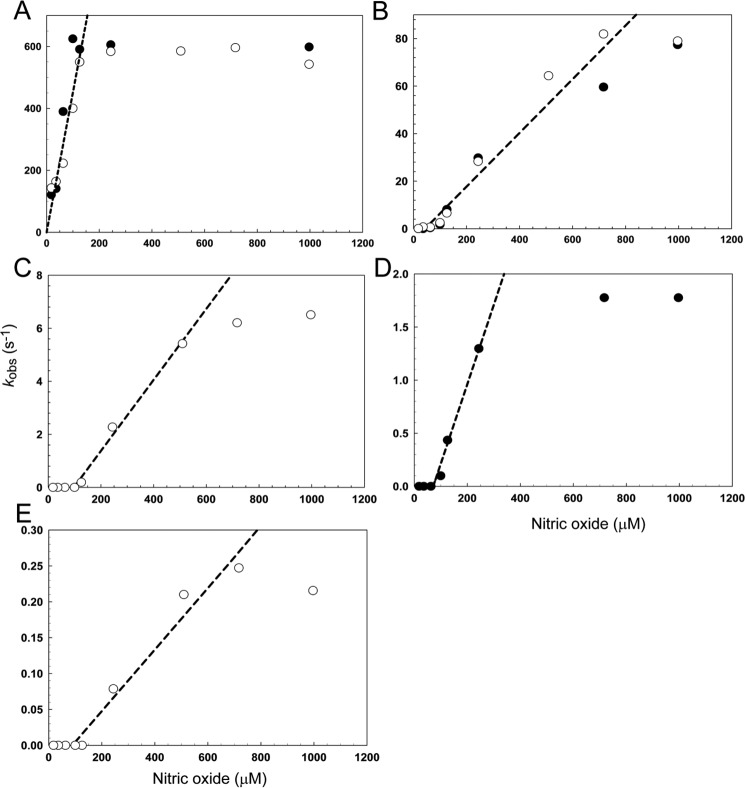
FIGURE 8.
Dependence of the observed rate constant for each step of nitrosylation on NO. A–E, plots of the observed (pseudo-first order) rate constant (kobs), obtained from fits of the kinetic data at 360 (open circles) and 420 nm (filled circles), over a range of NO concentrations. Note that panels A–E correspond to steps 1 to 5, respectively, of the reaction (see text). Least squares linear fits are shown giving apparent second order rate constants (see Table 2). The buffer was 20 mm Tris, 20 mm MES, 20 mm Bistris propane, 100 mm NaCl, 5% (v/v) glycerol, pH 8.0.

