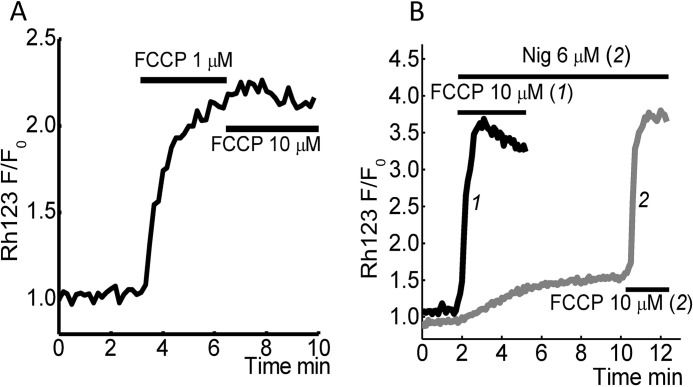
FIGURE 2.
Effect of nigericin and different concentrations of FCCP on mitochondrial membrane potential. Changes in ΔΨm were measured using Rh123 in dequench mode; the loss of potential is seen as an increase in fluorescence. A, representing the maximal increase in Rh123 fluorescence in response to complete mitochondrial depolarization by 1 μm FCCP followed by application of 10 μm FCCP, which has no effect on Rh123 fluorescence. B, effect of 6 μm nigericin on ΔΨm SH-SY5Y cells (gray line) followed by complete mitochondrial depolarization by 10 μm FCCP.

