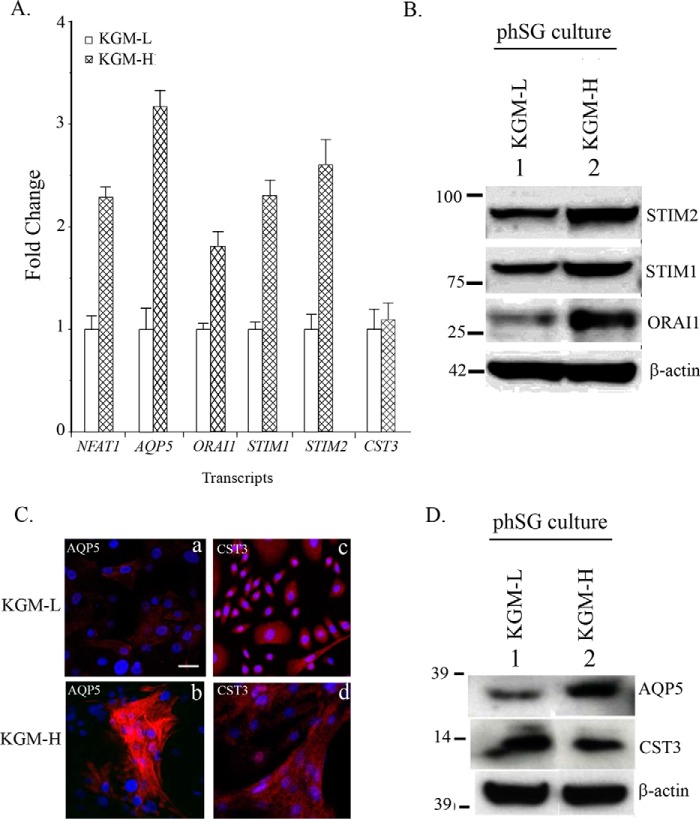
FIGURE 1.
Ca2+-dependent up-regulation of key Ca2+ signaling proteins and AQP5 in phSG cells. phSG cells cultured from minor salivary gland biopsies as described under “Experimental Procedures” were maintained in KGM-L. Cells were shifted to 1.2 mm [Ca2+]-containing medium for 3 days before use. A, quantitative real-time PCR analysis (see “Experimental Procedures” for details) of gene expression in KGM-L and KGM-H. Expression of NFAT, AQP5, Orai1, STIM1, STIM2, and CST3 is shown relative to their level in KGM-L medium. The data are mean ± S.E. from triplicate samples from three different experiments. B, representative Western blotting analysis showing levels of Orai1, STIM1, and STIM2 in cells maintained in KGM-H and KGM-L media. Average -fold changes (mean ± S.E.) of proteins in KGM-H versus KGM-L are STIM2 = 2.1 + 0.2; STIM1 = 1.8 + 0.2; and Orail = 3.2 + 0.3. p < 0.05 (data obtained from three experiments). C, immunofluorescence detection of AQP5 (a and b) and CST3 (c and d) in phSG cultures grown in KGM-L and KGM-H media. Scale bar = 50 μm. D, Western blotting analysis showing levels of AQP5 and CST3 in phSG cells in both media. Average -fold changes (mean ± S.E.) in KGM-H versus KGM-L were AQP5 = 3.5 + 0.4 and CST3 = 0.8 + 0.3. p < 0.05 (data obtained from three experiments).

