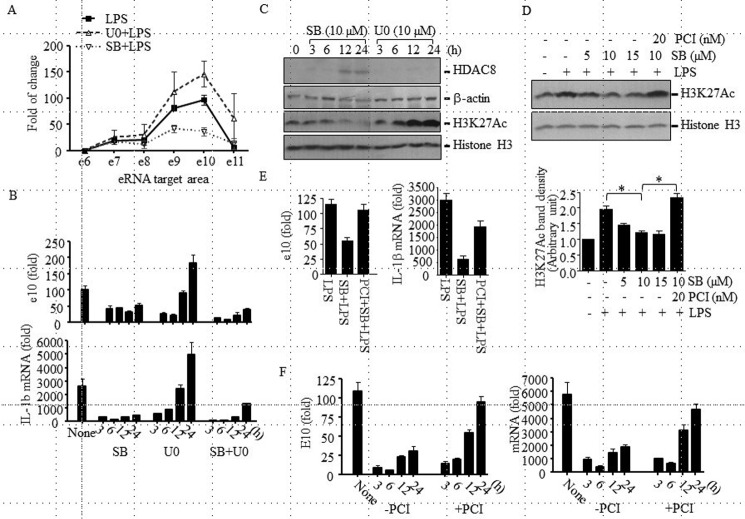
FIGURE 5.
HDAC8 involvement in the LeTx-induced inhibition of pro-IL-1β eRNA and mRNA expression in a p38 inhibition-dependent manner. A, RAW264.7 cells were pretreated with SB203580 (SB; 10 μm) or U0126 (U0; 10 μm) for 18–20 h and then treated with LPS (100 ng/ml) in the absence or presence of inhibitors for 1.5 h. Pro-IL-1β eRNA production was analyzed by qPCR. Data are expressed as means ± S.D. (n = 3). B, RAW264.7 cells were pretreated with SB (10 μm) or U0 (10 μm) or SB and U0 for the time indicated and stimulated with LPS (100 ng/ml) for 1.5 h. Pro-IL-1 β eRNA and mRNA productions were analyzed by qPCR. C, RAW264.7 cells were treated with SB (10 μm) or U0 (10 μm), and HDAC8 protein and H3K27Ac levels were analyzed by Western blot. Western blots for β-actin and histone 3 (H3) were used as loading controls. D, RAW264.7 cells were cultured in the presence or absence of SB (5–15 μm) ± PCI (20 nm) for 20 h and then treated with LPS (100 ng/ml) for 3 h. H3K27Ac levels were analyzed by Western blot. Western blots for histone H3 were used as loading controls. Bands intensities compared with loading controls were analyzed by the ImageJ program (National Institutes of Health) and are expressed as means ± S.D. (n = 3); Student's t test; *, p < 0.05. E, similarly, cells were pretreated with SB (10 μm) ± PCI (20 nm) for 20 h and then treated with LPS (100 ng/ml) for 90 min. Pro-IL-1β eRNA and mRNA productions were analyzed by qPCR. F, RAW264.7 cells were treated with LeTx (100 ng/ml LF and 100 ng/ml PA) for 2 h and further cultured in the fresh media with or without PCI (20 nm). LeTx-exposed or non-exposed cells were treated with LPS (100 ng/ml) for 1.5 h at the time indicated after LeTx treatment. Pro-IL-1β eRNA and mRNA levels were measured by qPCR. Data are expressed as means ± S.D. (n = 3).

