
FIGURE 7.
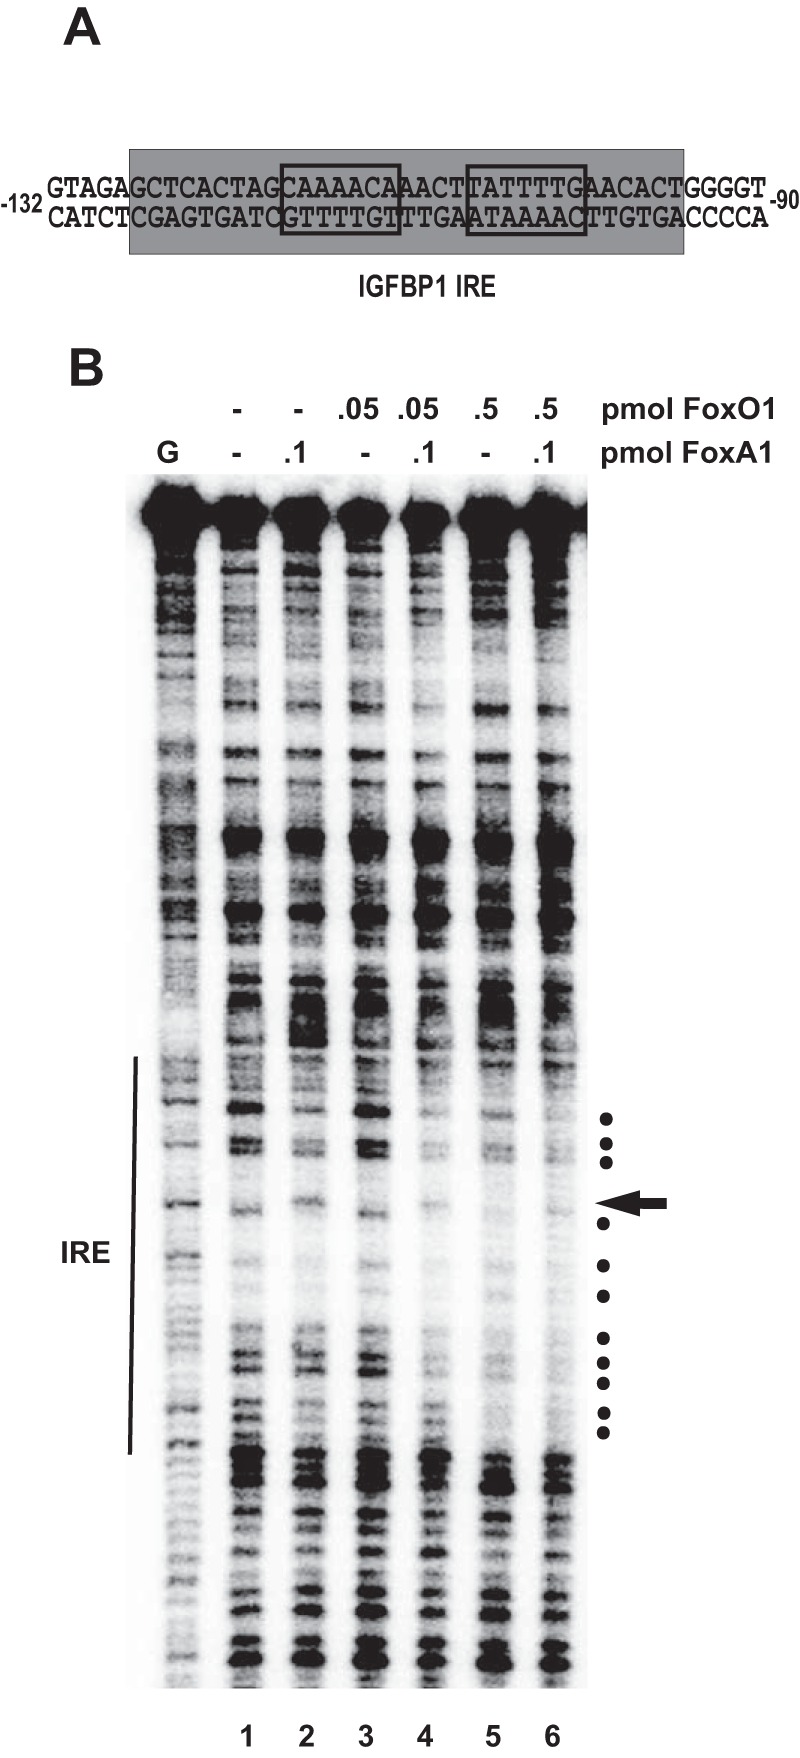
FoxO1 and FoxA1 cooperatively bind the IGFBP1 promoter. A, IGFBP1 IRE sequence. The boundaries of the footprint generated by FoxA1/A2 and FoxO1 binding are highlighted in gray, and the forkhead consensus sites are delineated by boxes. B, DNase I footprinting analysis of the designated pmol amounts of recombinant FoxO1 and FoxA1 bound to IGFBP1 promoter DNA. The position of the IRE is indicated at the left. Dots indicate footprinted sites, and the arrow indicates a hypersensitive site. This gel is representative of four independent DNase I footprinting experiments. G, guanine cleavage ladder marker.