FIGURE 3.
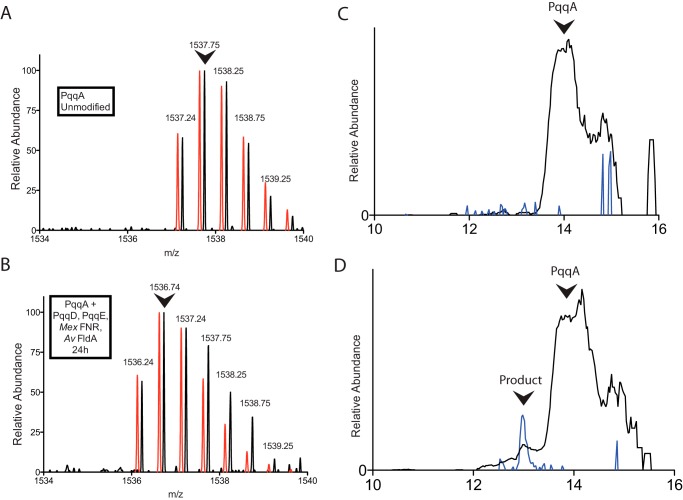
Modification of PqqA by PqqE and PqqD monitored by LC-MS. A, the initial 2+ ion mass envelope of unmodified PqqA. B, the 2+ mass envelope of a minor peak, eluting 1 min earlier, seen following a 24-h reaction under anaerobic conditions. A noticeable shift in mass by 2 Da is observed, consistent with cross-linking of residues in PqqA according to Fig. 5. In both A and B, the red spectra are calculated mass envelopes for PqqA (A) and modified PqqA (B), offset slightly for ease of comparison. Arrows indicate the most abundant ions, which were used to quantify the relative amount of modified PqqA. C, chromatograph showing the elution profile of 1537.7 (black) and 1536.7 (blue) ions in an unreacted PqqA sample. D, chromatograph showing the elution profile of 1537.7 (black) and 1536.7 (blue) ions in a 24-h reaction mixture; a small peak containing cross-linked PqqA is seen to elute earlier than the unreacted PqqA.

