FIGURE 7.
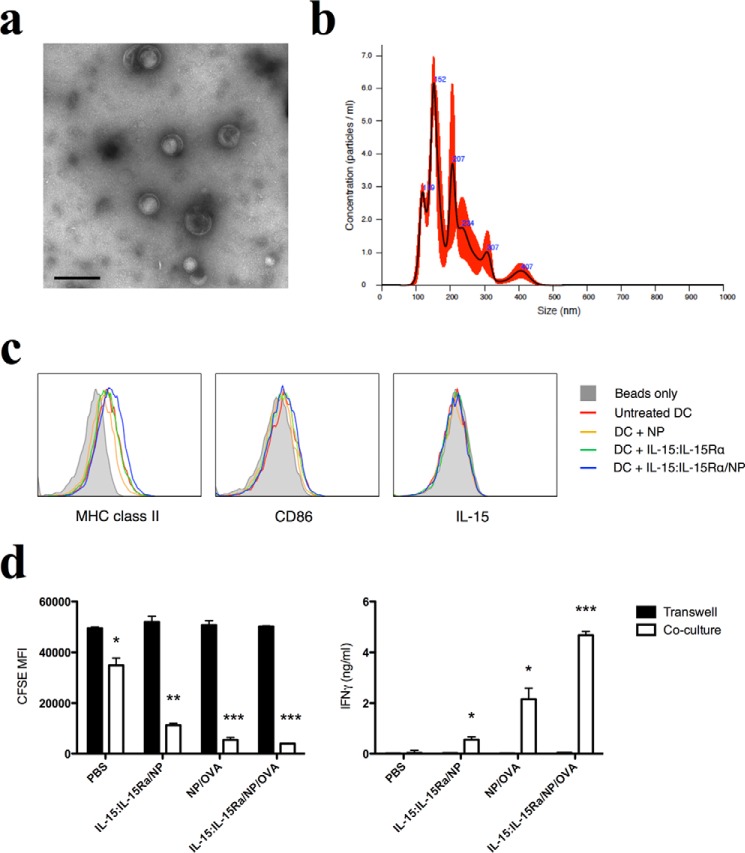
IL-15 is not associated with DC-derived exosomes. a, exosome preparations were visualized by TEM. Scale bar = 200 nm. A representative image is shown. b, representative size distribution plot of exosomes sized using nanoparticle tracking analysis. Black line, mean; red, error bars. c, exosome-associated proteins were analyzed by flow cytometry. Exosomes were adsorbed to aldehyde/sulfate beads and stained for MHC class II, CD86, and IL-15. d, NP-loaded DCs were assayed for their ability to stimulate antigen-specific T cell activation via exosomes. DCs were used to stimulate CFSE-labeled T cells either separated by a transwell (Transwell, black columns) or in direct cell contact (Co-culture, white columns). T cells were assayed for CFSE dilution (left panel) and IFN-γ secretion. The differences in mean values between the co-culture and Transwell experiments for each condition were compared using an unpaired t-test. *** indicates a significance level of p ≤ 0.001, ** indicates p ≤ 0.01, and * indicates p ≤ 0.05.

