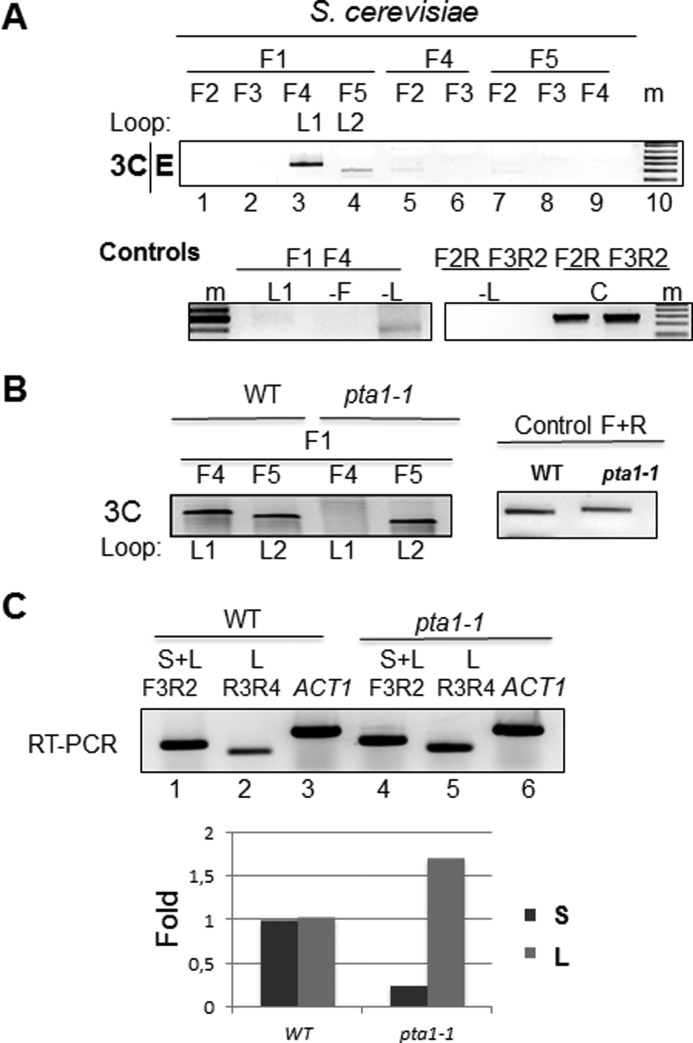
FIGURE 4.
Alternative gene loops at KlCYC1 expressed in S. cerevisiae. A, PCR products generated by 3C analysis of the KlCYC1 gene are depicted for cells in early log phase growth, E. Primer pairs (F1–F5) are depicted above each lane and shown schematically in Fig. 1B. The F1–F4 and F1–F5 PCR products correspond to looping between the KlCYC1 promoter and the poly(A)-1 (L1) and the poly(A)-2 sites (L2), respectively. B, 3C analysis of the KlCYC1 gene in an isogenic WT and pta1-1 strain pair (C). Control experiments as described in Fig. 2C.

