
FIGURE 5.
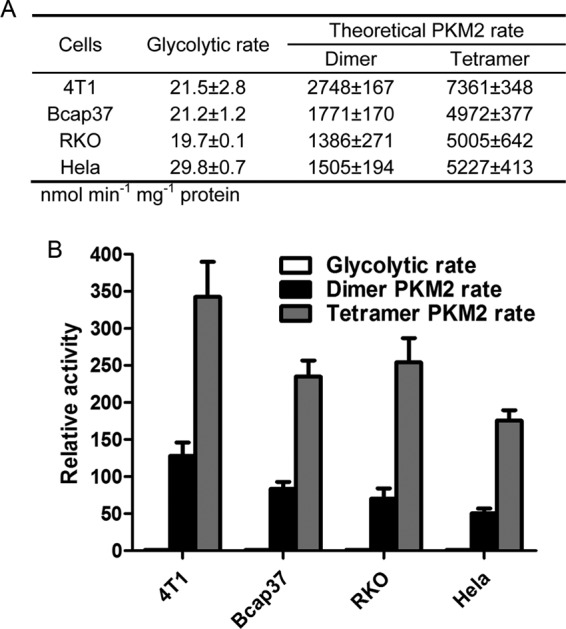
Actual glycolytic rates of live cancer cells in comparison with the theoretical catalytic rates of PKM2 dimer and tetramer. A, glycolytic rates of live cancer cells were described under “Experimental Procedures.” Theoretical catalytic rates were calculated according to Michaelis-Menten equation, using the Vmax from Fig. 2, and Km values 0.03 mm (tetramer) and 0.5 mm (dimer) from Ref. 33. B, catalytic rates of PKM2 dimer and tetramer relative to actual glycolytic rates of live cancer cells. Data are mean ± S.D., n = 3.