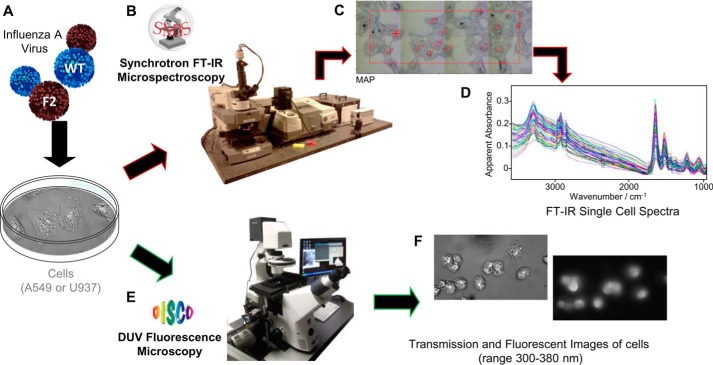
FIGURE 1.
SOLEIL synchrotron FTIR and DUV set up and experiments. A, A549 or U937 cells were infected with IAV virus expressing (WT) or not PB1-F2 (F2), fixed at various times post-infection and collected prior to observation by IR or DUV microscopy. B, the image shows the Continuum XL microscope (Thermo Fisher Scientific) used for FTIR microspectroscopic analysis performed on the SMIS beamline. C, transmission image representing IAV-infected A549 cells observed with the Continuum XL microscope before recording the IR spectra. Each annotated red cross corresponds to the acquisition of one single cell IR spectrum. D, recorded IR spectra in the 3500–1000 cm−1 region. Spectra were standardized and pre-treated before multivariate statistical analysis. E, the image shows the Telemos full field microscope used to record the Trp fluorescence of IAV-infected cells in the DUV with the DISCO beamline. F, transmission image in bright field microscopy (left image) and DUV fluorescent microscopy (right image) of IAV-infected U937 cells are presented.

