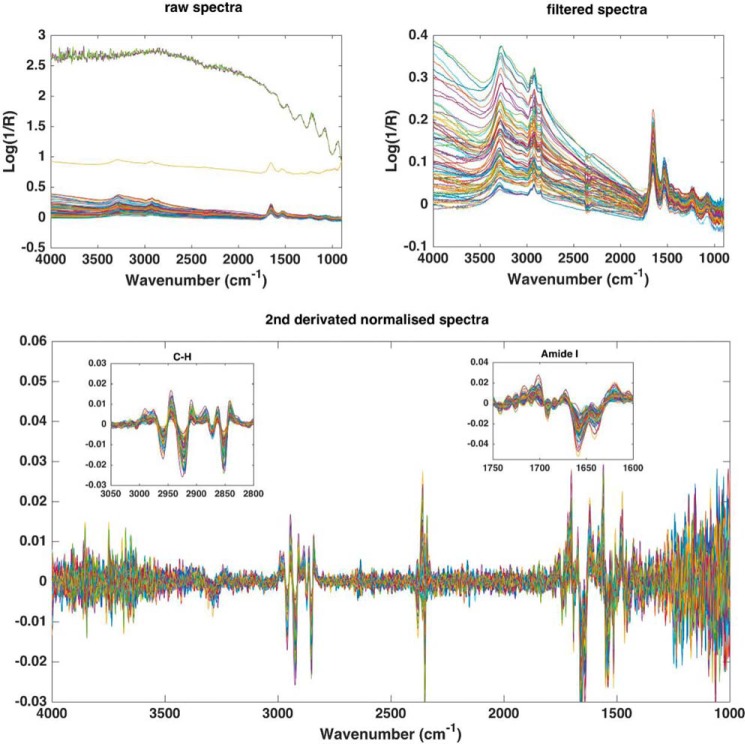
FIGURE 2.
Infrared spectra preprocessing procedure. Top left, raw spectra, top right, filtered spectra (to remove background disturbed spectra), and bottom, 2nd derivative Savitzky-Golay spectra (9 pts, 2 order) and unit vector normalized. A close-up view on CH stretching and the Amide I region are shown in the bottom panel.

