FIGURE 3.

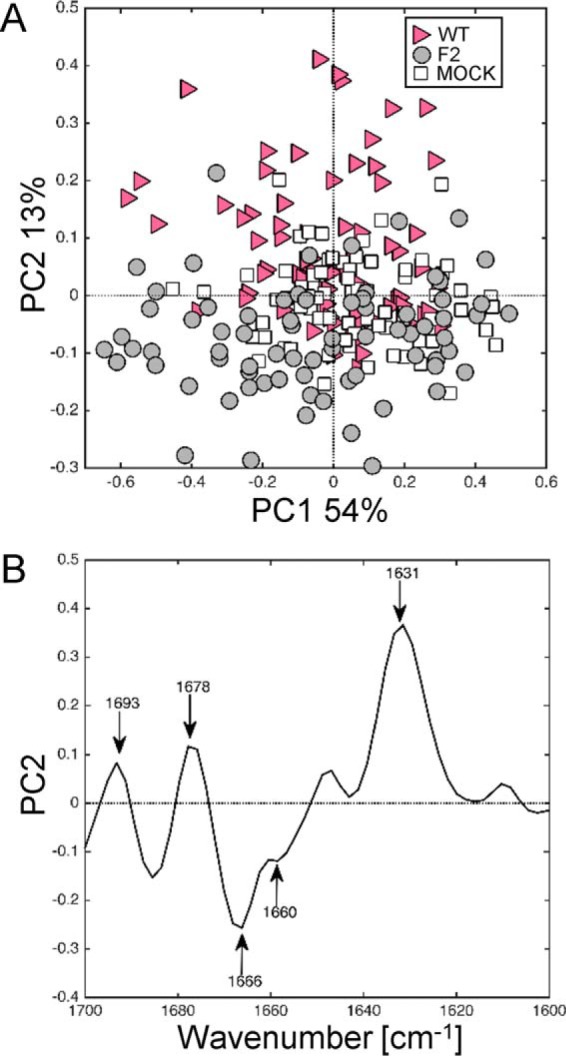
Synchrotron IR microspectroscopy comparison between the secondary structure contents of mock, WT-, and F2-infected U937 cells at 8 h post-infection within the amide I region. A, score plot of PCA from the 1700–1600 cm−1 band IR spectra. The explained variance for PC1 and PC2 is 54 and 13%, respectively. Marked data with the pink triangle correspond to U937 cells infected with WT virus, gray circle to cells infected with F2, and white square to mock-infected cells. B, loading plot linking the variable space and principal component subspace (PC2). PCA score plots show that the WT and F2-mock groups separate along PC2. Compared with mock and F2 groups, the WT group shows higher IR intensity at 1631–1693 cm−1 bands attributed to aggregated β-sheet structures and at the 1678 cm−1 band assigned to turns structures. PC, principal component.
