FIGURE 4.

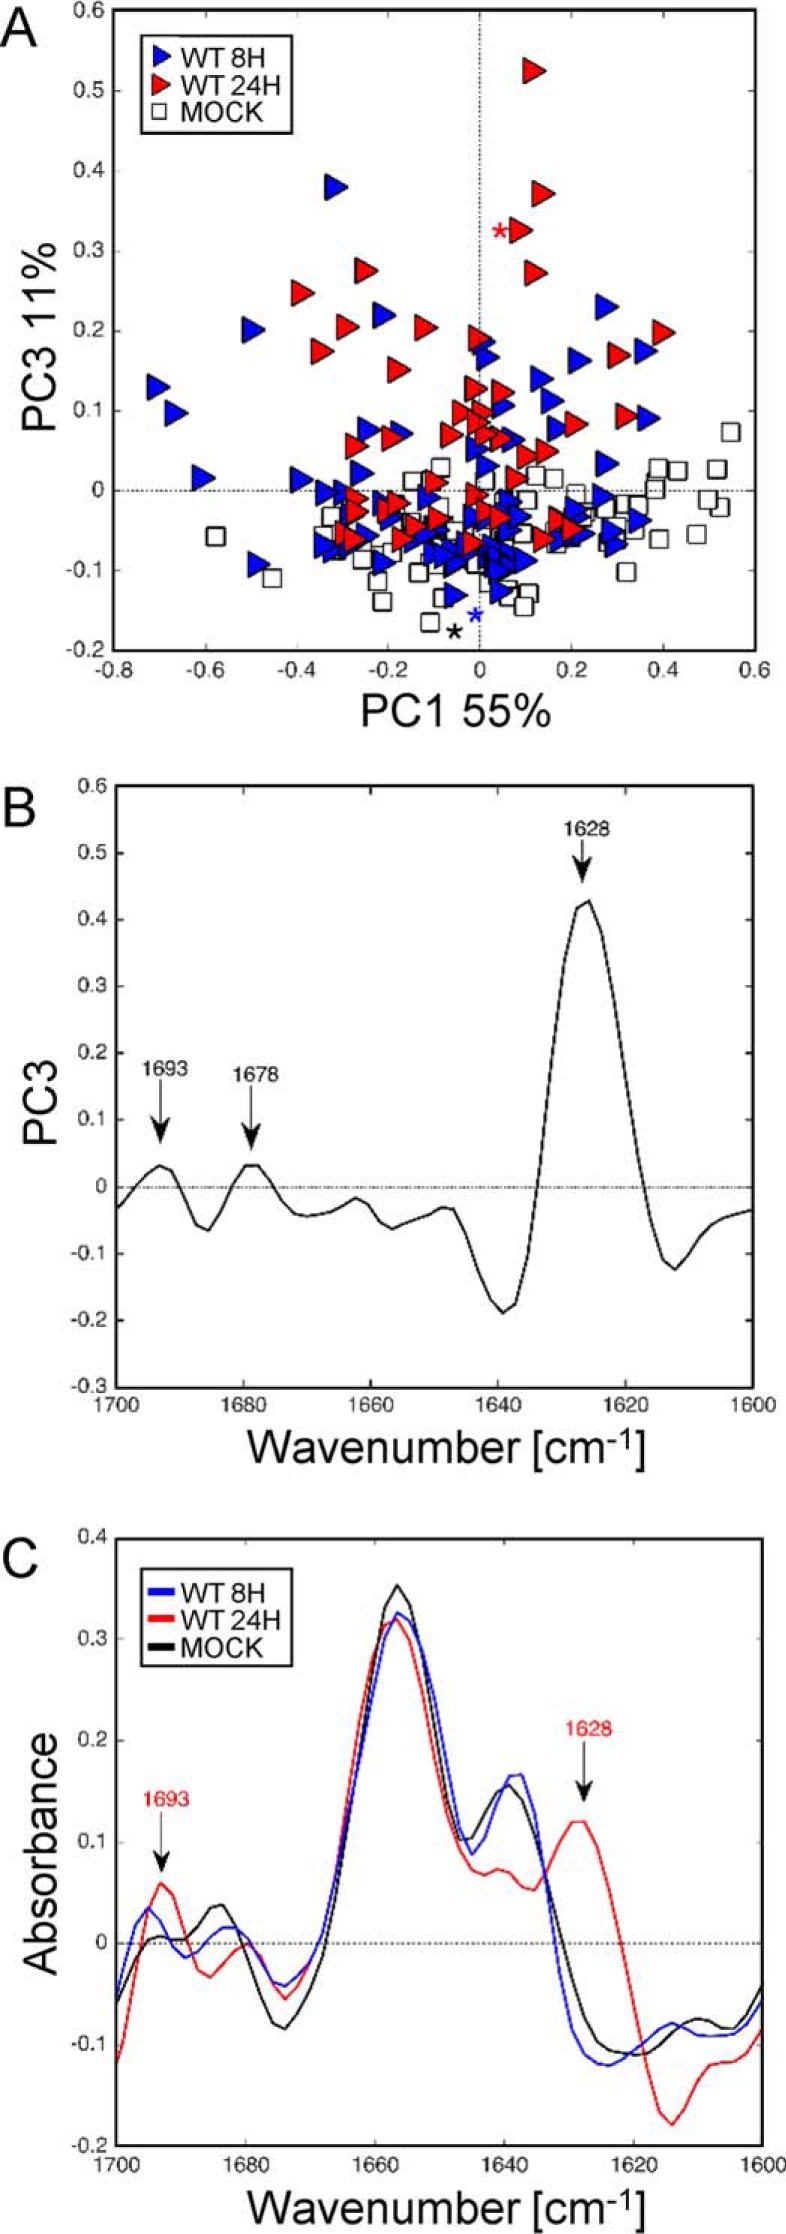
Synchrotron IR microspectroscopy comparison between the secondary structure content of mock and WT-infected U937 cells at 8 and 24 h post-infection within the amide I region. A, score plot of PCA from the 1700–1600 cm−1 band IR spectra. The explained variance for PC1 and PC3 is 55 and 11%, respectively. Marked data with the white square corresponds to mock-infected cells and blue and red triangles correspond to cells infected with WT virus at 8 and 24 h post-infection, respectively. B, loading plot linking the variable space and principal component subspace (PC3). PCA score plots show that the WT and mock groups separate along PC3. Compared with the mock group, WT groups show higher IR intensity at 1628–1693 cm−1 bands attributed to aggregated β-sheet structures. C, marked points second derivative spectra: mock-infected cells (black line) and WT-infected cells at 8 (blue line) and 24 h (red line) post-infection in the range 1700–1600 cm−1. A progressive shift from 1643 cm−1 (unordered β-sheet structure) to 1628 cm−1 was observed in a time-dependent manner for WT-infected cells 2nd derivative spectra compared with mock-infected cells. PC, principal component.
