FIGURE 6.
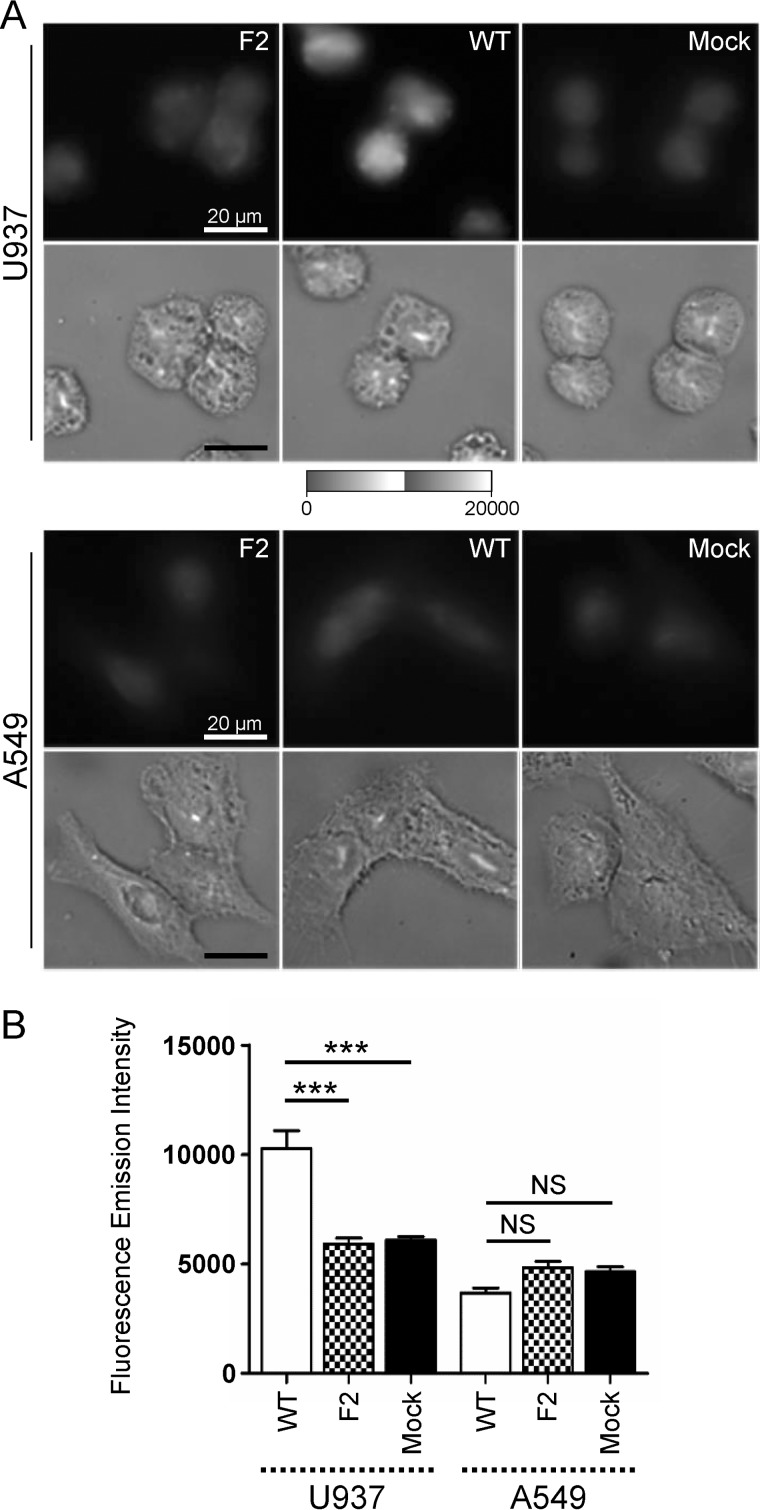
Synchrotron deep UV microspectroscopy comparison of fluorescence intensity between mock, WT, and F2-infected cells at 8 h post-infection within the 300–380 nm emission range. A, U937 (top panel) and A549 (bottom panel) cells were infected and observed at 8 h post-infection. For each condition, WT, F2, and mock-infected cells, the fluorescent image obtained by the DUV fluorescent microscope within the 300–380 nm emission range (top) and its corresponding image obtained by transmission microscopy (bottom) are presented. Cells were observed with a ×100 objective. The greyscale was the same for all the fluorescent images. Bars = 20 μm. B, comparison of the fluorescence intensity measured in mock, WT, and F2-infected cells. Fluorescence intensity were quantified using ImageJ software and normalized to the surface area of the cells. Data are expressed as mean ± S.E. by an analysis of variance test. ***, p < 0.001, NS, not significant.

