FIGURE 8.

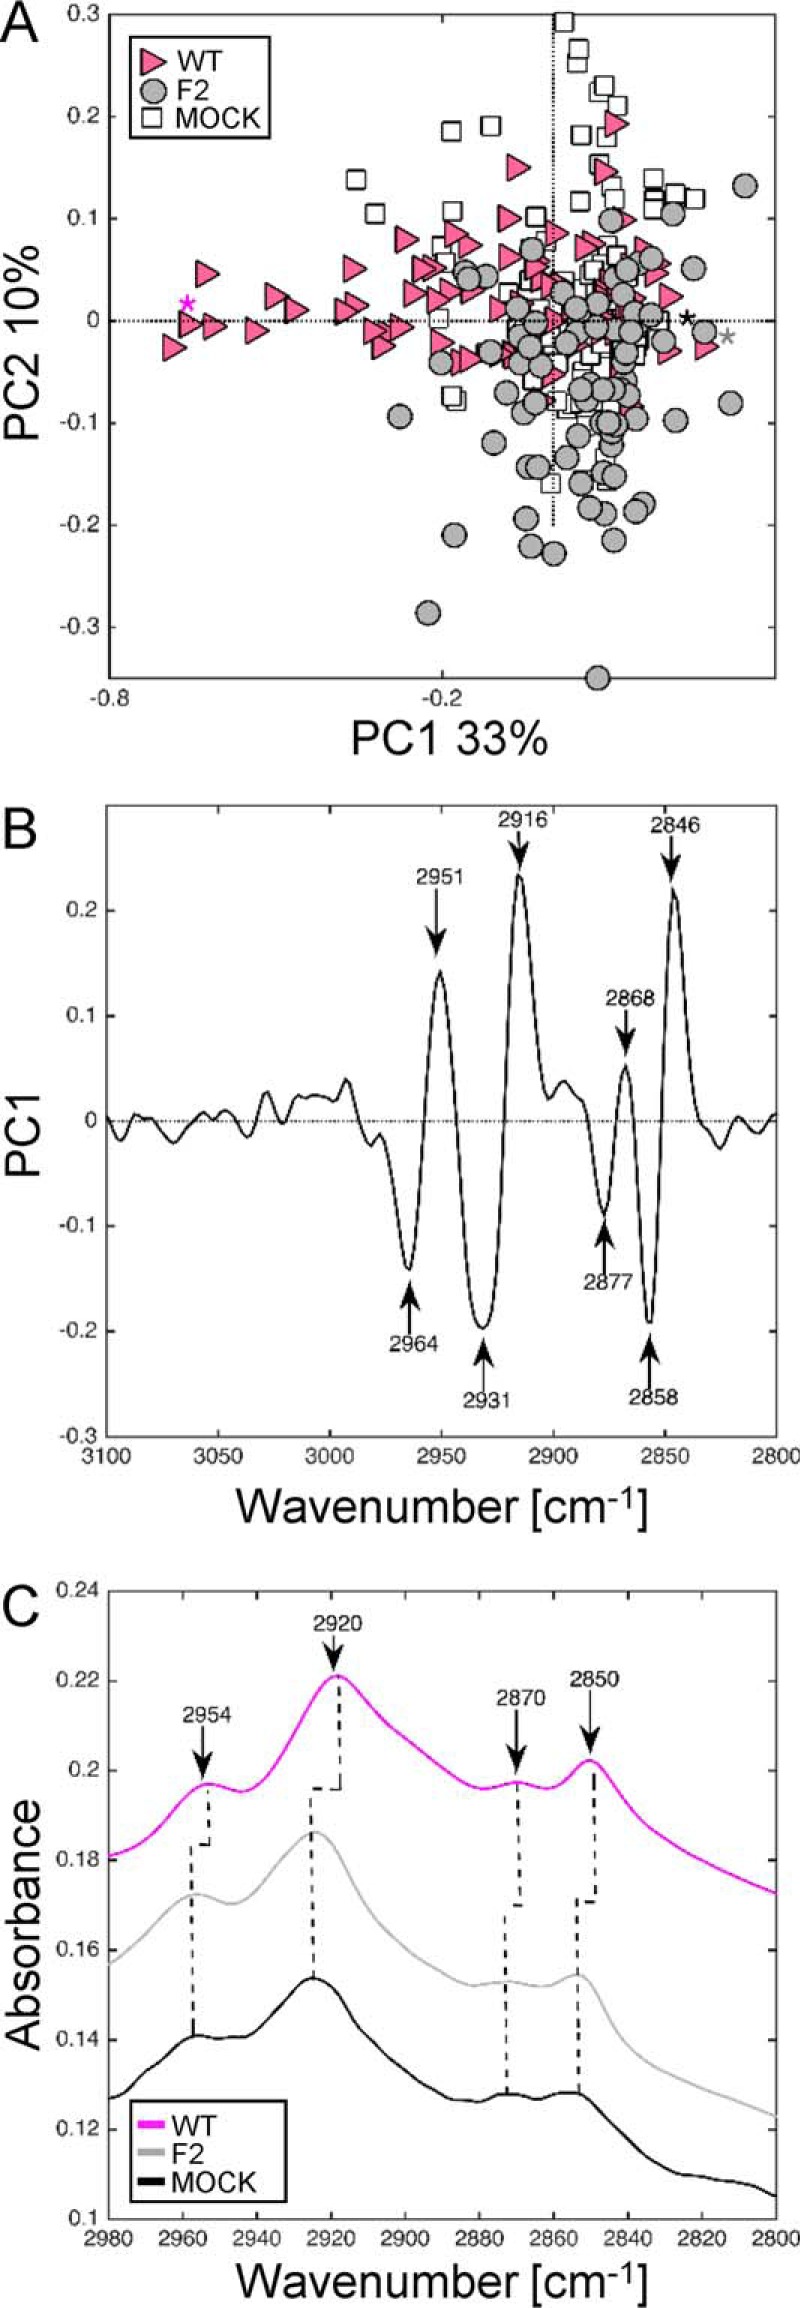
Synchrotron IR microspectroscopy comparison of mock, WT, and F2-infected U937 cells at 8 h post-infection within the CH region. A, score plot of PCA from the 3100–2800 cm−1 band IR spectra. The explained variance for PC1 and PC2 is 33 and 10%, respectively. Marked data with pink triangles correspond to U937 cells infected with WT virus, gray circle to cells infected with F2 virus, and white square to mock-infected cells. B, loading plot linking the variable space and principal component subspace (PC1). PCA score plots show that the WT and F2-mock groups separate along PC1. C, mean IR spectra of mock-infected cells (black line), WT (pink line), and F2-infected cells (gray line) at 8 h post-infection in the 2980–2800 cm−1 range. A shift for the principal peaks corresponding to CH2-CH3 stretching (2954, 2920, and 2850 cm−1) associated to perturbation of membrane fluidity was observed for WT-infected cells spectra compared with mock and F2-infected cells. PC, principal component.
