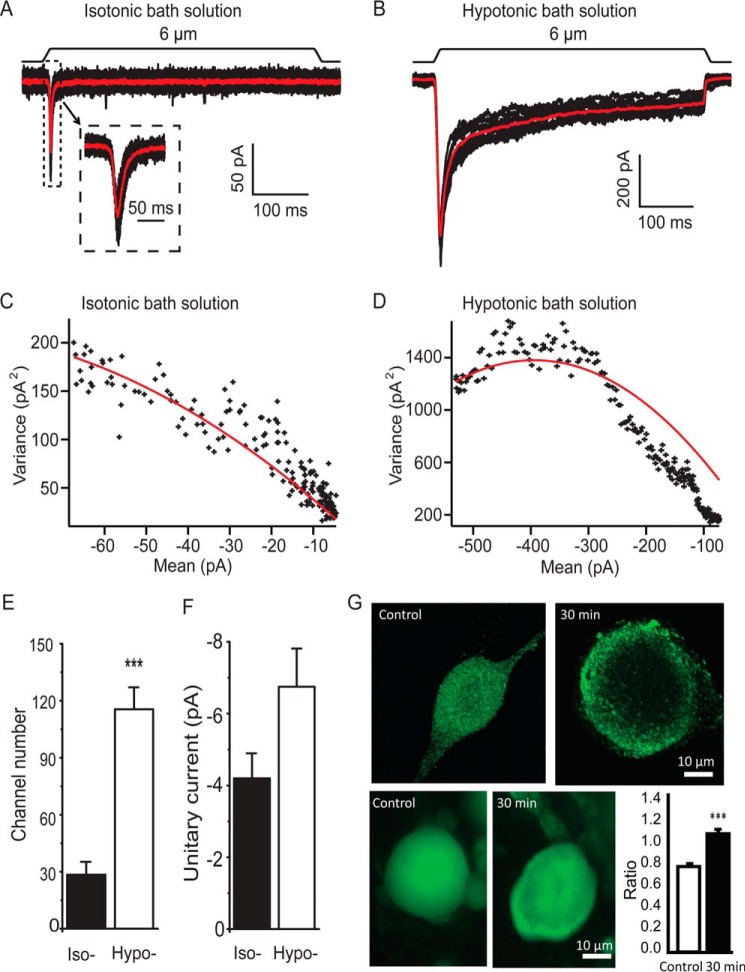
FIGURE 5.
Assessment of channel numbers and unitary current sizes of RA-MA channels on DRG membranes. A, set of RA-MA traces recorded from a cultured DRG neuron in response to repeated stimulation. The recording was conducted in isotonic bath solution. The red trace is the average of the multiple responses. Inset, at an expanded scale. B, similar to A except RA-MA currents were recorded 30 min after treating the cell in hypotonic bath solution (220 mosm). C and D, plots of the variance versus mean values of RA-MA currents with curve fitting (red) for the experiments in isotonic (C) and hypotonic bath solution (D). E, summary data of channel numbers in cells tested in isotonic bath solution (n = 9) and hypotonic bath solution (n = 6). F, summary data of unitary current size in cells tested in isotonic bath solution (n = 9) and hypotonic bath solution (n = 6). G, top two images show confocal imaging of Piezo2 immunoreactivity in a cell without (control, left) and a different cell with osmotic swelling (right); piezo2 immunoreactivity intensity is higher on plasma membranes than in cytosol compartment following osmotic swelling in hypotonic bath solution for 30 min (right). Bottom two images are similar to the top images except they were taken under epifluorescence illumination. Bar graph on bottom right panel shows summary data of immunofluorescent intensity ratio between the values measured at the perimeters and measured 5 μm away from the perimeters in the cells; epifluorescence images were used for the summary data. Open bar, control cells without osmotic swelling (n = 46); solid bar, cells treated with 220 mosm hypotonic bath solution for 30 min (n = 39). Data represent mean ± S.E., ***, p < 0.001.

