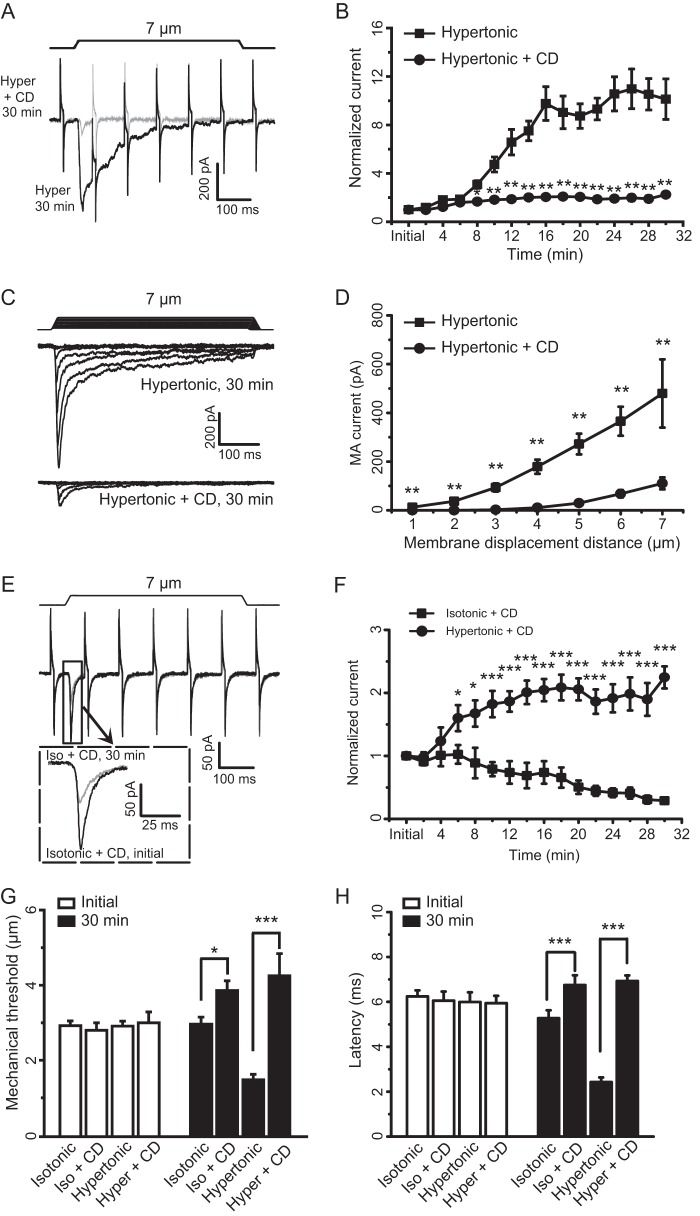
FIGURE 7.
Disruption of actin filaments by cytochalasin D abolishes osmotic swelling-induced potentiation of RA-MA currents in cultured DRG neurons. A, two sample traces show RA-MA currents recorded 30 min after establishing the whole-cell mode using hypertonic recording internal solution without (black) or with 10 μm cytochalasin D (CD, gray). The membrane displacement step was 7 μm. B, summary data of RA-MA currents over time after establishing the whole-cell mode using hypertonic recording internal solution either without (squares, n = 14) or with 10 μm CD (circles, n = 8). C, two sets of sample traces of RA-MA currents elicited by different membrane displacement steps and recorded 30 min after establishing the whole-cell mode. The recordings were done by using hypertonic recording internal solution either without (top) or with 10 μm CD (bottom). Membrane displacement steps at 1-μm increments are indicated above RA-MA current traces. D, summary data of the experiments represented in C using hypertonic recording internal solution either without (squares, n = 7) or with 10 μm CD (circles, n = 7). E, two sample traces show RA-MA currents recorded at initial time (black) and 30 min (gray) after establishing the whole-cell mode using isotonic recording internal solution that also contained 10 μm CD. Inset, expanded scale for the boxed region. The membrane displacement step was 7 μm. F, summary data of RA-MA currents over time for the experiments represented in E (squares, n = 9). RA-MA currents that were recorded with hypertonic recording internal solution containing 10 μm CD (n = 9) are also presented in this graph for a comparison. G and H, summary data of mechanical thresholds (G) and onset latency (H) for eliciting RA-MA currents at initial time (open bars) and 30 min (closed bars) after establishing the whole-cell mode. Mechanical thresholds (G) and latency (H) were obtained by recordings made with the following recording internal solutions: isotonic internal solution (isotonic), isotonic internal solution that contained 10 μm CD (iso + CD), hypertonic internal solution (hypertonic), and hypertonic internal solution that contained 10 μm CD (hyper + CD). Data represent Mean ± S.E., *, p < 0.05; **, p < 0.01; ***, p < 0.001.

